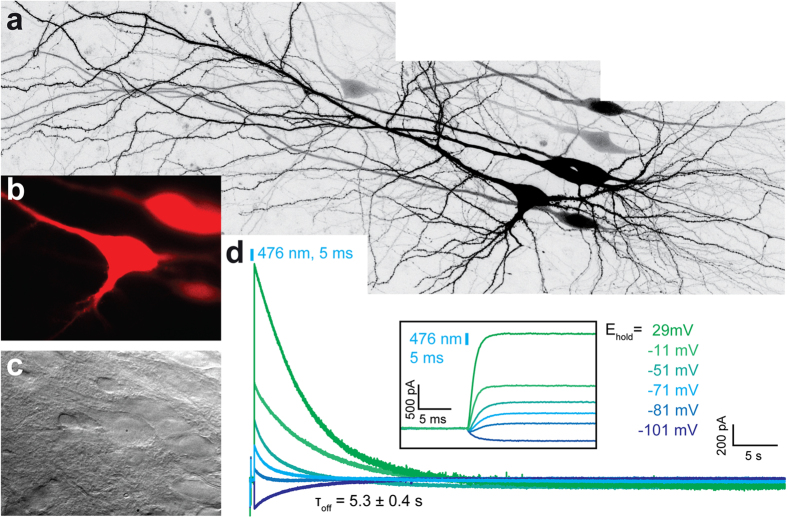
Figure 3. Expression of iChloC in CA1 pyramidal cells in organotypic hippocampal slice culture.
(A) Overview of neuronal morphology 5 days after electroporation (maximum intensity projection of two-photon images). (B) Fluorescence of co-expressed tdimer2 was used to target transfected neurons for electrophysiological recordings (same cells as in (A)). (C) Dodt contrast image of cells shown in (B). (D) Photocurrents in response to a single light pulse (476 nm, 5 ms, 1 mW/mm2) at different holding potentials. Photocurrents reversed at very negative holding potentials and were large at depolarized holding potentials, where the Cl− inward driving force was highest (same neuron as in (A–C)). The inset shows the onset of the photocurrents at higher temporal resolution. Indicated holding potentials were rounded to full numbers after subtraction of the liquid junction potential (−10.6 mV). Indicated tau value was derived from 9 independent measurements in 9 slice cultures.

