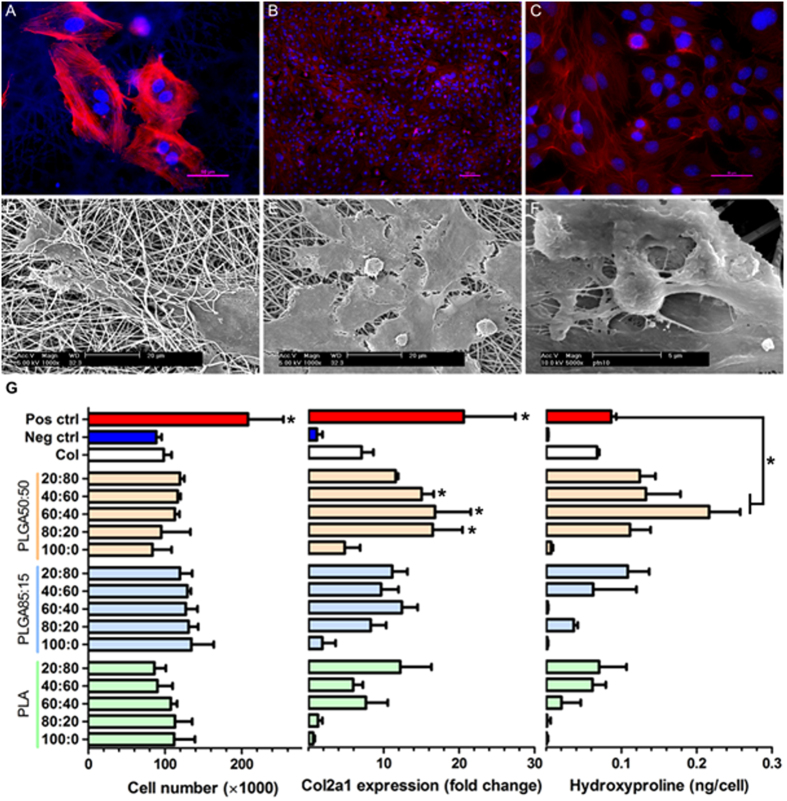
Figure 2.
Representative fluorescent images with actin filaments in red and nucleas blue (A–C) and SEM (D–F) images of ATDC5 chondrocyted cultured on electrospun scaffolds 24 hours (A,D) and 14 days (B,C,E,F) after seeding. (E,F) provide a high magnification image of chondrocytes on the scaffold. Screening of electrospun scaffolds on day 14 (G). No significant differences in cell number detected between the scaffolds (ANOVA, p = 0.0581, N = 3) however the positive control is significantly higher than electrospun conditions (*p < 0.0001). Col2a1 gene expression of the cells on the scaffolds was compared to the positive control. There was no significant difference between col2a1 expression of the positive control and 3 of the scaffolds (marked with an *) which are all significantly higher than the remaining substrates (Dunnett’s test, p < 0.0001, N = 3). Similarly, hydroxyproline production on scaffolds was compared to the positive control using Dunnett’s multiple comparison test. Hydroxyproline production is at its maximum on five scaffolds which are higher than the positive control, however two are significantly so (marked *p < 0.0001, N = 3).

