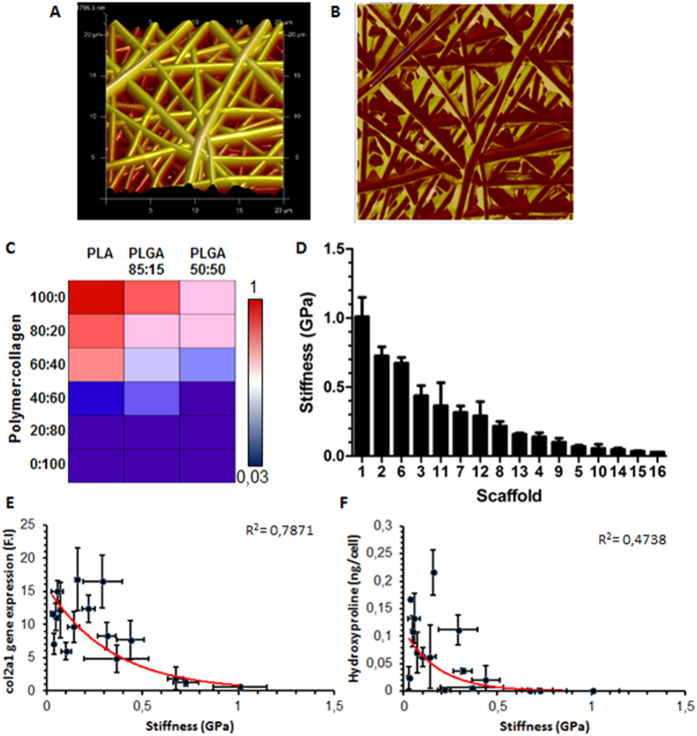
Figure 4. AFM analysis of scaffolds.
Representative surface image of PLA scaffold (A). PeakForce scan of scaffold measuring DMT modulus of fibres (B). Mode average elastic modulus of scaffolds decreasing with the addition of collagen and increasing glycolide content (C). Linear range of elastic moduli of scaffolds ranging from the stiffest to the weakest (D). As stiffness increases, both col2a1 expression and hydroxyproline content decrease. A negative exponential fit results in a reasonable correlation between stiffness and col2a1 expression (R2 = 0.7871) (E) and hydroxyproline (R2 = 0.4738) (F).

