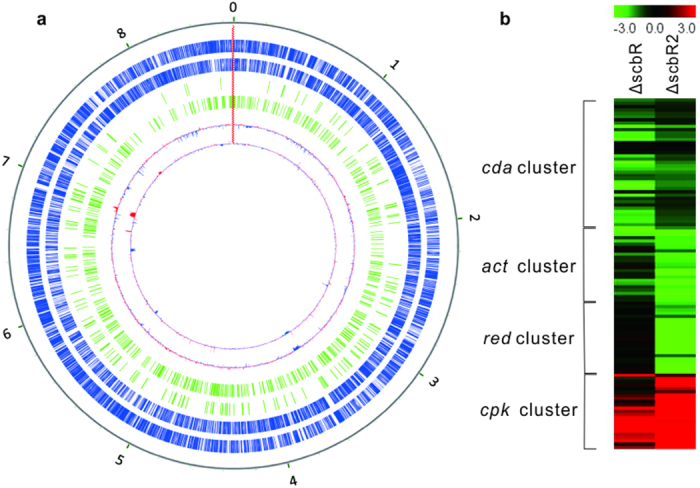
Figure 2. Distribution and attributes of global targets of ScbR and ScbR2.

(a) A map of the S. coelicolor genome with ChIP-seq of ScbR and ScbR2 and transcriptome profiling data of their mutants. From the outmost to the innermost, coding sequences in the genome are shaded in blue as the two outer circles, the genomic distribution of ScbR and ScbR2 targets are shown in green. The transcriptome profiling of scbR and scbR2 mutants are indicated in the innermost two circles: the red lines represented genes up-regulated by mutation, while the blue indicated down-regulated genes. (b) Transcriptional effects of ScbR and ScbR2 on four antibiotic cluster genes. Red indicates activation; green indicates repression, while dark means no change.
