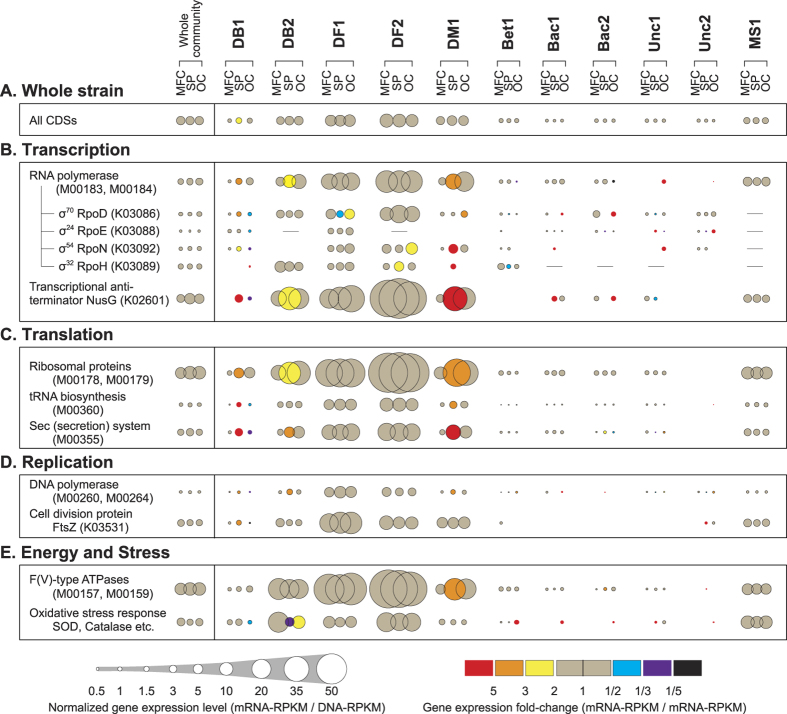
Figure 3. Overall gene expression levels and dynamics related to microbial cell activities for each Bin-genome.
Mean gene expression levels were calculated from all CDSs in each Bin-genome (A). Gene expression levels and changes for selected marker gene families related to transcription (B), translation (C), replication (D), and energy and stress (E) were calculated (see Supplementary Data 1). Normalized gene expression levels (mRNA-RPKM/DNA-RPKM) for each Bin-genome under the three operational conditions is described by the size of circle, while gene expression dynamics (mRNA-RPKM/mRNA-RPKM) is described by the circle color of SP (expression fold-change from MFC to SP) and the circle color of OC (expression fold-change from SP to OC).

