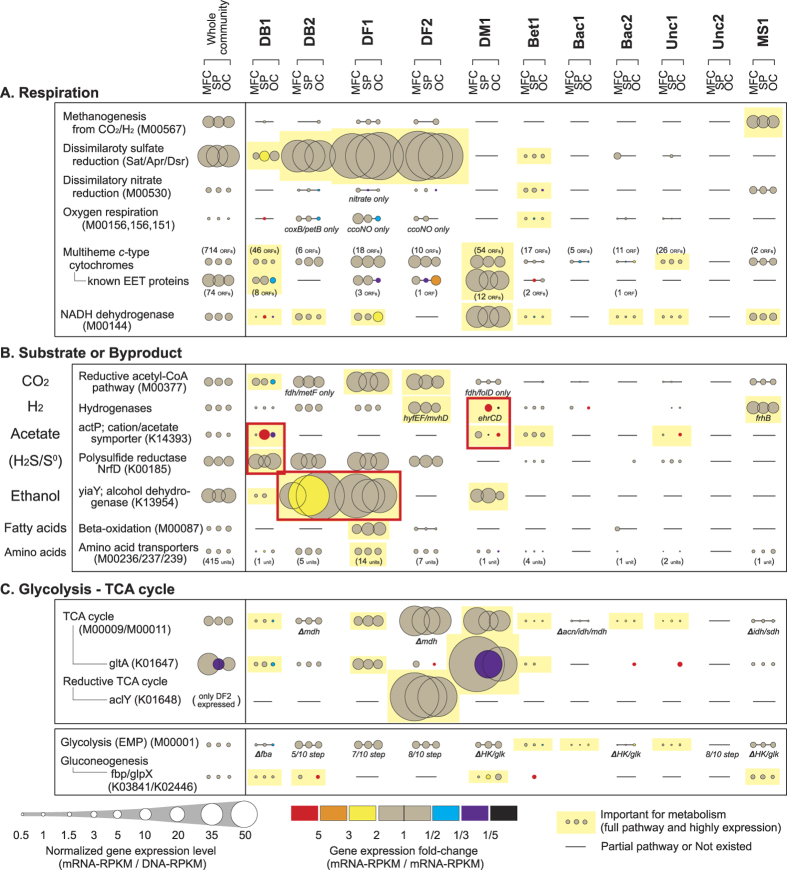
Figure 4. Overall gene expression levels and dynamics related to microbial metabolisms for each Bin-genome.
Gene expression levels and changes were calculated (see Supplementary Data 2) for selected metabolism-related marker gene families associated to respiration (A) substrate consumption or byproduct production (B) and glycolysis and TCA cycle (C). Normalized gene expression levels (mRNA-RPKM/DNA-RPKM) for each Bin-genome under the three operational conditions is described by the size of circle, while gene expression dynamics (mRNA-RPKM/mRNA-RPKM) is described by the circle color of SP (expression fold-change from MFC to SP) and the circle color of OC (expression fold-change from SP to OC). Important gene sets for the metabolic pathway analyses within the community are indicated by yellow rectangles highlighting the circles. Bars indicate partial pathways of a given KEGG module or no existence of the KEGG orthology/module, and the elements of the incompleteness are described below the bar. Red rectangles indicate potential metabolism switches after stimuli addition.

