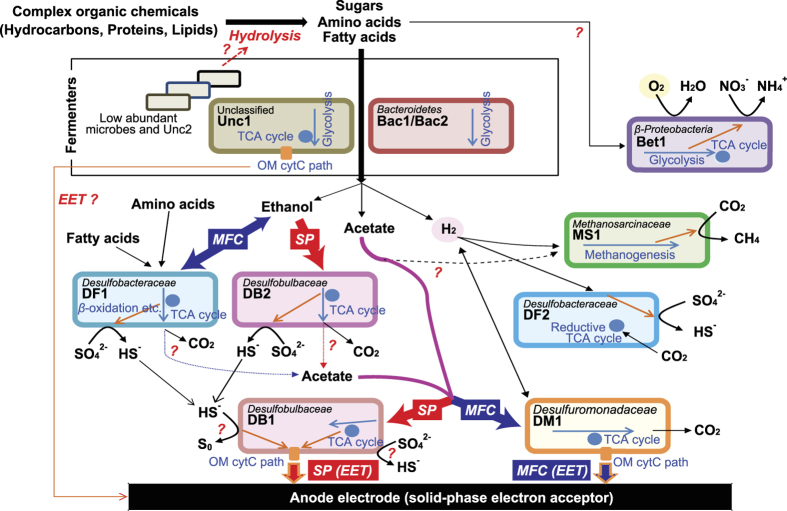
Figure 5. Estimated metabolic network between dominant microbes within the EET-active microbial community.
Metabolic roles of eleven Bin-genomes (colored rounded rectangles) are estimated from the cell activity and metabolism-associated gene expression dynamics related to EET stimuli additions. Metabolism switches between MFC and SP conditions are described by thick arrows with blue (MFC) or red (SP) color. Intracellular and extracellular EET processes are described by orange arrows. Cytoplasmic carbon metabolic flows are described by right blue arrows.

