
Figure 2.
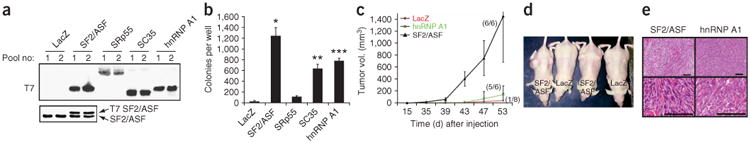
SF2/ASF transforms immortal cells and is tumorigenic in nude mice. (a) Total proteins from duplicate pools of NIH 3T3 stable cell lines transduced with retroviruses expressing LacZ or T7-tagged SF2/ASF, SRp55, SC35 or hnRNP A1 were analyzed by western blotting with anti-T7. The first four samples were also analyzed with anti-SF2/ASF (below) to compare the expression of endogenous and transduced SF2/ASF (b) Quantification of soft-agar colony formation by the stably transduced cell lines. The mean ± s.d. for each pair of pooled lines is shown. P-values in pairwise comparisons to the LacZ control: *P=4 × 10⁻⁸; **P = 10−7; ***P = 7 × 10⁻⁸. (c) Tumor growth curve in mice injected with 2 × 10⁶ cells from the indicated NIH 3T3 pooled lines. The number of tumors formed per number of injections is shown in parentheses. SRp55 and SC35 cell lines (six each) did not form tumors during the same time course (data not shown). Error bars, s.d. (d) Representative mice injected with LacZ-expressing control cells, or with SF2/ASF-overexpressing cells. (e) Light micrographs of formalin-fixed, paraffin-embedded tissue sections from tumors derived from NIH 3T3 cells overexpressing SF2/ASF of hnRNP A1, stained with hematoxylin and eosin. Scale bars, 100 μm.