
Figure 6.
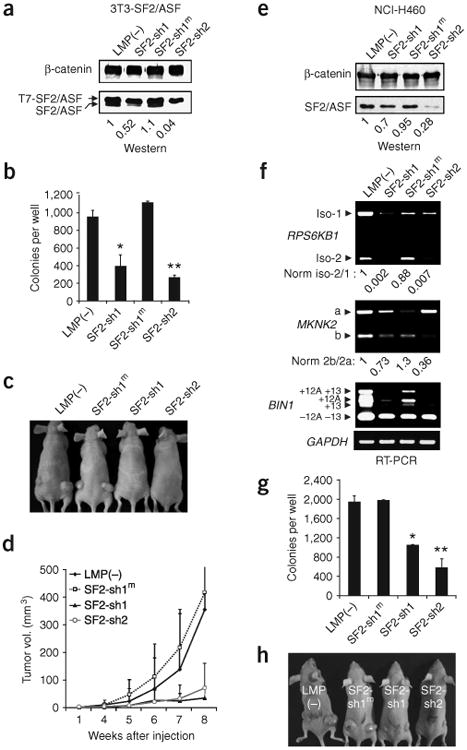
Knockdown of SF2/ASF reverses transformation of NCI-H460 cells and SF2/ASF-overexpressing NIH 3T3 cells. (a) Western blot analysis of SF2/ASF in NIH 3T3 cells overexpressing SF2/ASF after transduction with viruses expressing the indicated SF2/ASF shRNAs. The SF2/ASF-specific shRNAs target the 3′ UTR of SF2/ASF and therefore affect only the endogenous SF2/ASF (lower band), for which normalized protein levels are shown under the blot. SF2-sh1m is a control shRNA with two mismatches. (b) Cells described in a were seeded in soft agar, and colonies were counted 14 d later; means ± s.d. are shown. P-values for comparisons to the LMP(–) control: *P = 2 × 10⁻⁷; **P = 2 × 10⁻⁹. (c,d) Cell lines described in a were injected into nude mice (n = 8 injections) and tumor volume was measured weekly; error bars indicate s.d. Representative mice are shown. (e) Western blot of total protein from NCI-H460 cells as in a. (f) RNA from the cells in e was analyzed by RT-PCR and RT-qPCR to detect MKNK2, RPS6KB1 and BIN1 isoform levels, with GAPDH as a control. Normalized ratios of RPS6KB1 isoform-2 to isoform-1 and MKNK2 2b to 2a calculated from the RT-qPCR data are shown under the corresponding gels. (g) Soft agar colony formation by cells described in e. Means ± s.d. are shown. P-values calculated as in b: *P = 3 × 10⁻¹¹; **P = 2 × 10⁻¹⁵. (h) Cell lines described in a were injected into nude mice (n = 8 injections). Representative mice are shown.