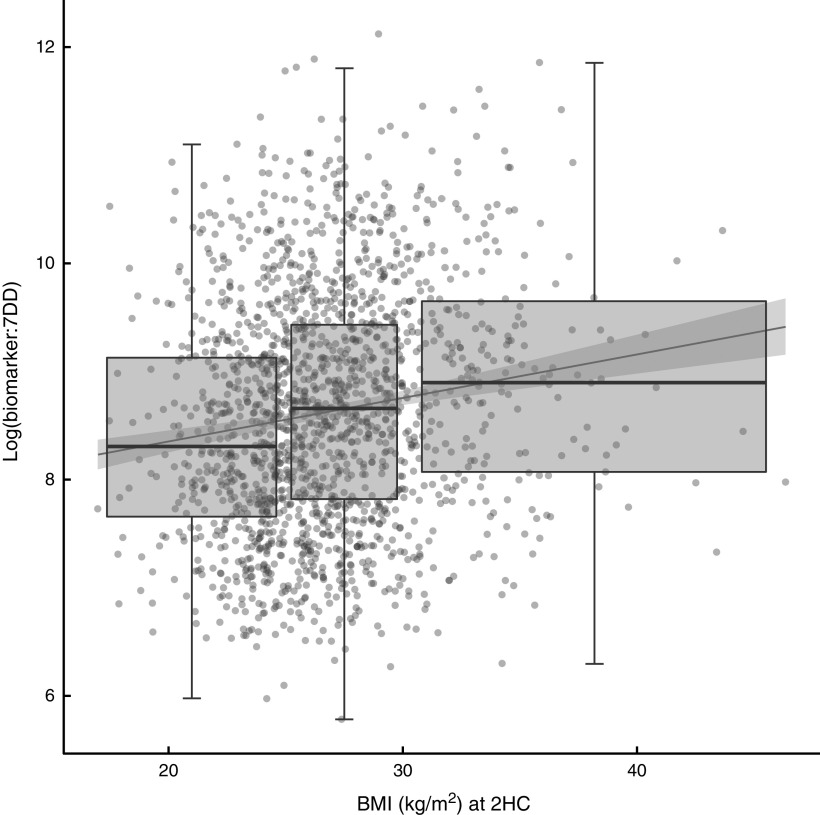
Fig. 2.
Relationship between the biomarker (specific-gravity-adjusted urinary sucrose) and self-reported intake (energy-adjusted sucrose intake, as assessed by 7 d diet diary (7DD)), expressed as a ratio, and BMI after three years of follow-up among men and women (n 1734) aged 39–77 years, Norfolk cohort of the European Prospective Investigation into Cancer and Nutrition (EPIC-Norfolk). Presented are box-and whisker plots in which the bottom and top of the box represents the 25th and 75th percentile, respectively (the interquartile range), the line within the box represents the median and the bottom and top of the whisker represents the minimum and maximum value, respectively, of log-transformed ratio of biomarker to 7DD for three BMI classes (normal weight (left), overweight (middle) and obese (right)) at the second health check (2HC); and a least-square linear model with 95 % confidence interval ( )
)

