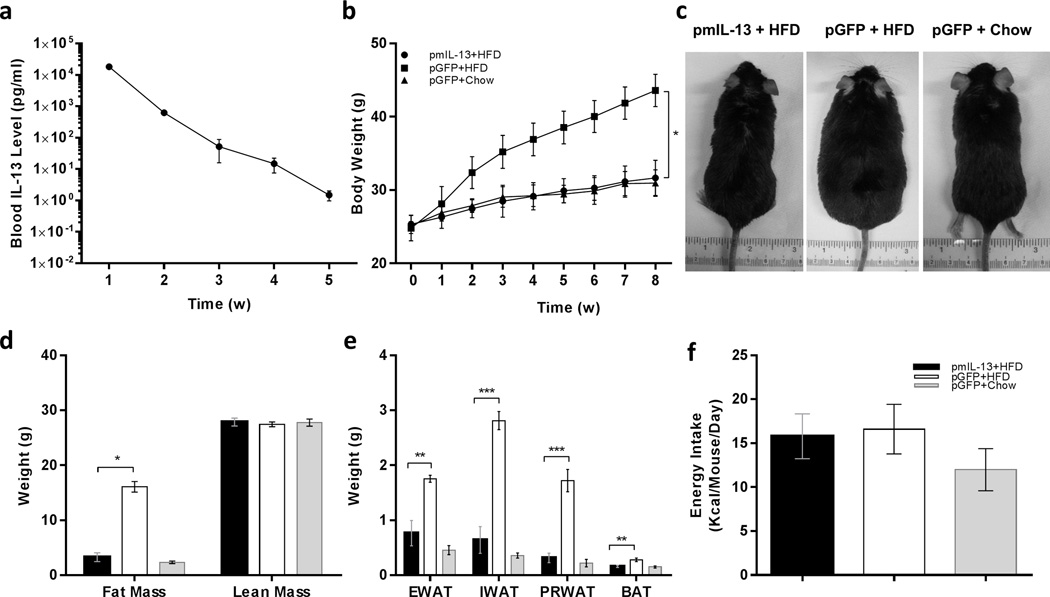
Figure 1. Time dependent expression of mIL-13 and its impact on body weight and energy intake of mice fed either regular or high fat diet.
(a) Serum level of IL13 in normal mice after hydrodynamic delivery of 1µg/animal of pLIVE-mIL13 plasmid; (b) body weight gain of animals over an 8-week period after hydrodynamic injection of 1µg/mouse of pLIVE-mIL13 fed an HFD (●) or pLIVE-GFP plasmids fed a regular chow (Δ) or HFD (■); (c) representative images of animals 8 weeks after gene transfer and fed with either a regular chow or an HFD; (d) body composition; and (e) weight of epididymal (EWAT), inguinal (IWAT) and perirenal (PRWAT) fat pad of animas at the end of 8-week on selected diets after plasmid transfer; and (f) average energy intake (kcal/mouse/day) of animas with gene transfer. Solid bars (■) represents animals injected with pLIVE-mIL13 plasmids and fed a HFD; open bars (□) represents animals injected with pLIVE-gfp plasmids and fed an HFD; and grey bars (■) represent animals injected with pLIVE-gfp and fed a regular chow. Data represent mean ± SEM (n=5). * P<0.05 compared with pGFP+HFD mice; **, P<0.05 compared to pGFP+HFD mice, and *** P<0.01 compared to pGFP+HFD mice.

