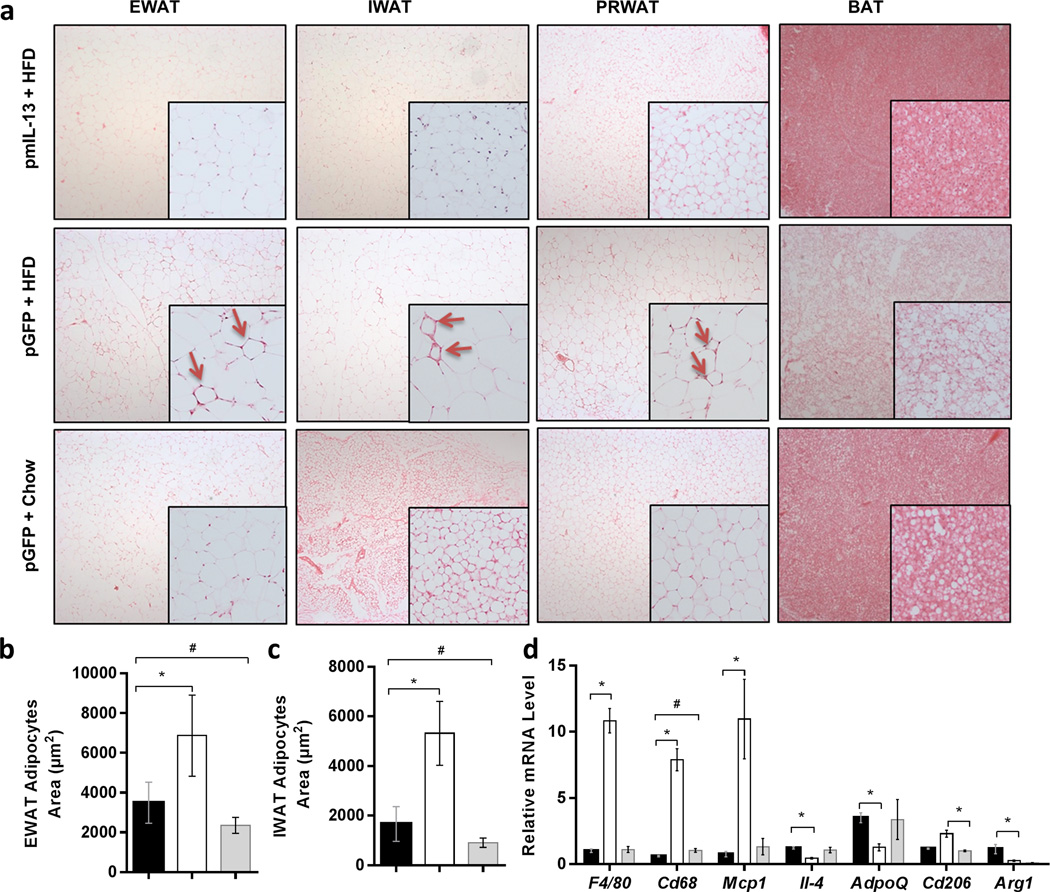
Figure 2. mIl-13 gene transfer prevented adipocyte hypertrophy and adipose tissue inflammation.
(a) Representative images of hematoxylin and eosin stained tissue sections of EWAT, IWAT, PRWAT and brown adipose tissue (BAT); (b) average size of adipocytes in EWAT; (c) average size of adipocytes in IWAT, and (d) relative mRNA levels of proinflammatory and anti-inflammatory genes in EWAT. Values in b and c represent average ± SEM of total number of adipocytes seen in three tissue slices (63 adipocytes per slice). (■) Animals injected with pLIVE mIl-13 plasmids and fed an HFD; (□) animals injected with pLIVE-GFP plasmids and fed HFD and (■) animals injected with pLIVE-GFP plasmids and fed a regular chow. Data represent mean ± SEM (n=5). * P<0.05 compared with pGFP+HFD mice; # P<0.05 compared with pGFP + Chow mice.

