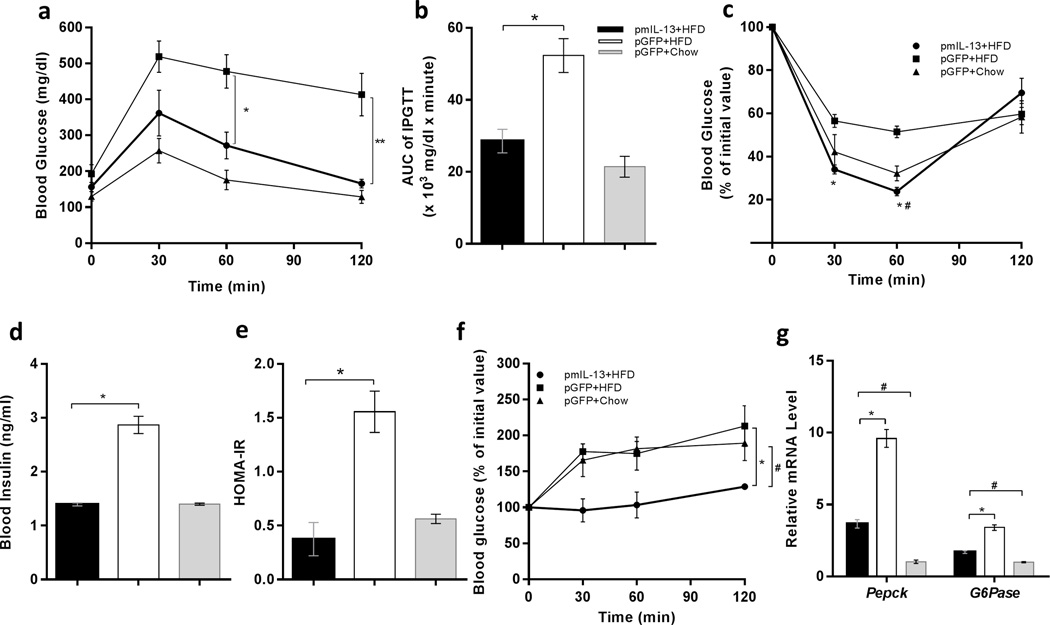
Figure 3. Hydrodynamic delivery of mIl-13 gene maintained glucose tolerance and insulin sensitivity in mice fed a HFD.
(a) Intraperitoneal glucose tolerance test (IPGTT); profile of blood glucose concentration versus time; (b) area under the curve of IPGTT after intraperitoneal injection of glucose solution; (c) insulin tolerance test (ITT); profile of blood glucose concentration (percentage of initial value) as a function of time upon intraperitoneal injection of insulin; (d) fasting insulin level in the mice; (e) result of homeostatic model assessment for insulin resistance (HOMA-IR); (f) pyruvate tolerance test; profile of blood glucose concentration versus time after intraperitoneal injection of sodium pyruvate solution; and (g) relative mRNA levels of gluconeogenesis related genes, Pepck and G6Pase in liver. In panels a and c: (●) Animals injected with pLIVE-IL13 plasmids and fed an HFD; (■) animals injected with pLIVE-GFP plasmids and fed an HFD; and (▲) animals injected with pLIVE-GFP plasmids and fed a regular chow. In panels b, d, e and f: (■) animals injected with pLIVE-IL13 plasmids and fed an HFD; (□) animals injected with pLIVE-GFP plasmids and fed an HFD; and (■) animals injected with pLIVE-GFP plasmids and fed a regular chow. Data represent mean ± SEM (n=5). * P<0.05 compared with pGFP +HFD mice; # P<0.05 compared to pGFP + Chow mice.

