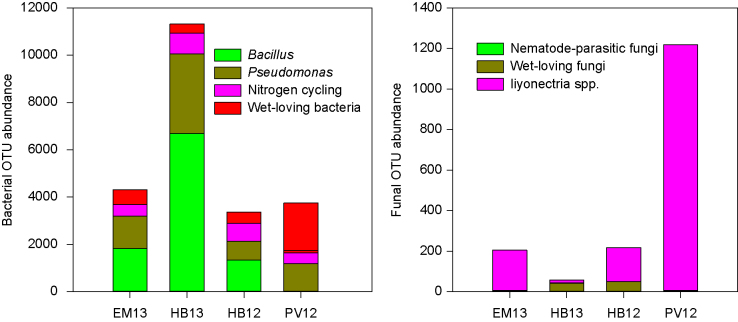
Figure 8.
Relative abundance of the 16 (12 bacterial and 4 fungal OTUs – Table 7) organisms per sample that may have played a role in affecting strawberry yield decline observed at HB12 and PV12; counts data were proportionally adjusted to the total reads of 300 000 per sample. Samples from chloropicrin-treated plots at HB12 and PV12 were excluded.

