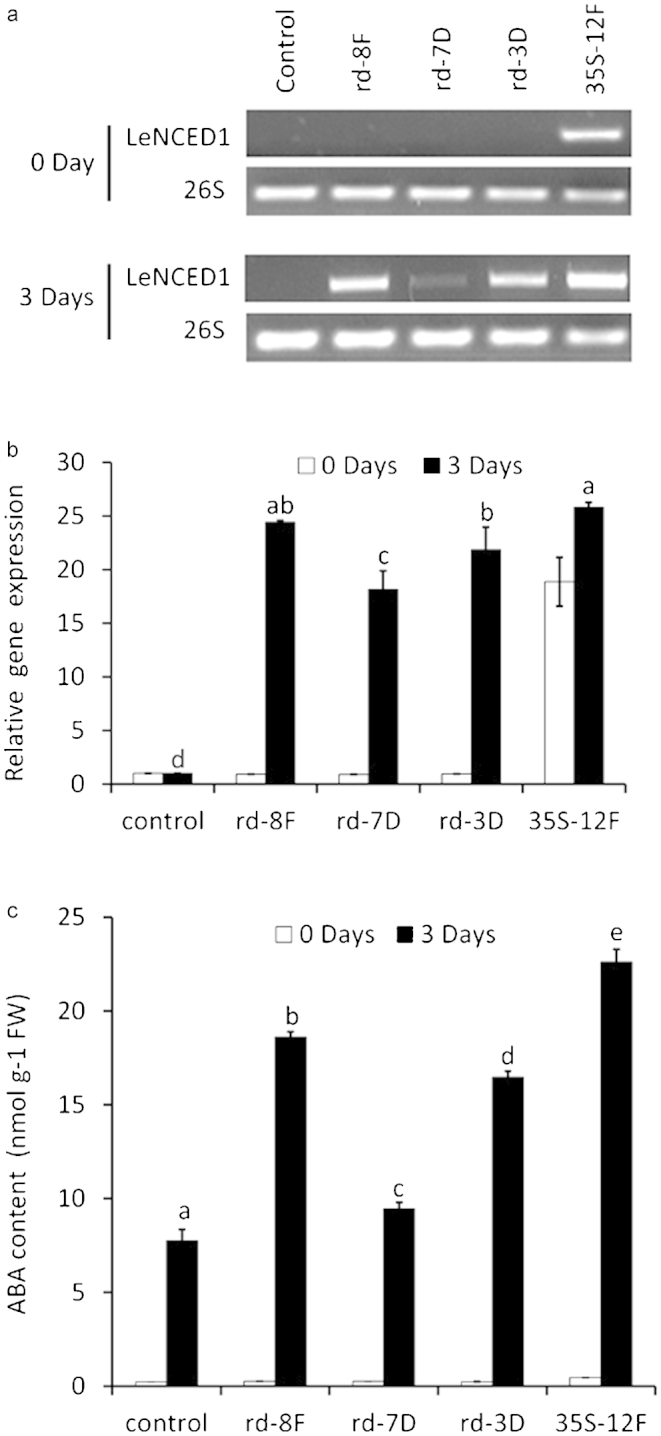
Figure 5.

LeNCED1 expression and ABA content in LeNCED1-overexpressed petunia. Plants of non-transformed control, transgenic rd29A:LeNCED1 lines 8F, 7D, 3D, and CaMV-35S:LeNCED1-12F line were grown in UC mix soils in greenhouse for 6 weeks under non-stress conditions and were subjected to drought treatment by withholding irrigation for 3 days. Transcript abundances of the LeNCED1 were determined with semi-quantitative RT-PCR using intact leaves after 0- and 3-day drought treatment (a, b). Error bars show SE of the means of three biological replicates; different letters denote significant differences using t-test at P > 0.05. ABA contents were measured using ELISA methods as described in M & M (c). Leaf samples were taken from the non-transformed control, transgenic rd29A:LeNCED1 and CaMV-35S:LeNCED1 lines at 0 and 3 days after drought treatment. Data are means ± SD (n = 6). Different letters denote significant differences at the 0.05 level.
