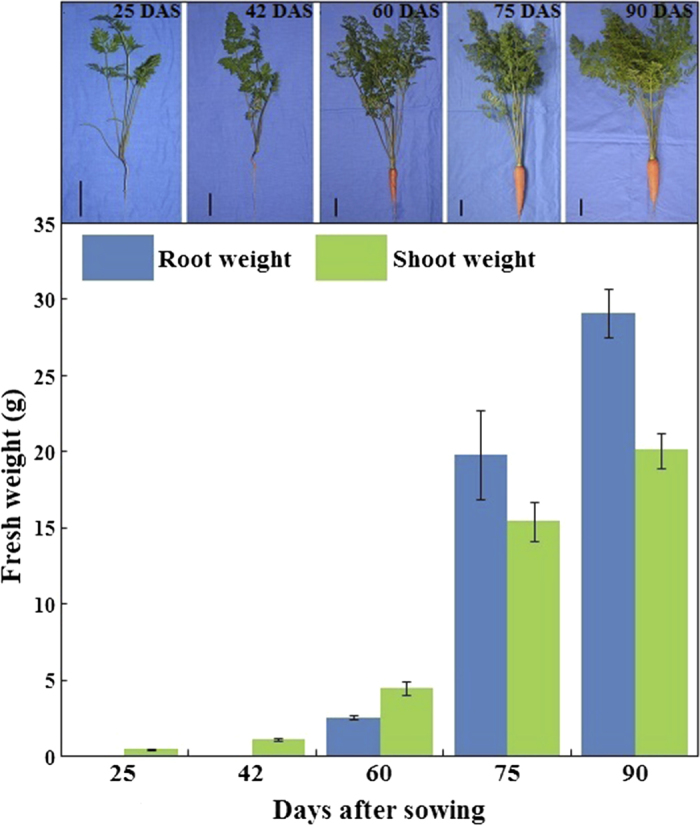
Figure 2.

Description of root weight and shoot weight during carrot growth and development. Carrot samples at 25, 42, 60, 75, and 90 days after sowing were harvested. Black lines in the lower left corner of each plant represent 3 cm in that pixel, whereas error bars represent standard deviation among three independent replicates. Data are the mean ± SD of three replicates.
