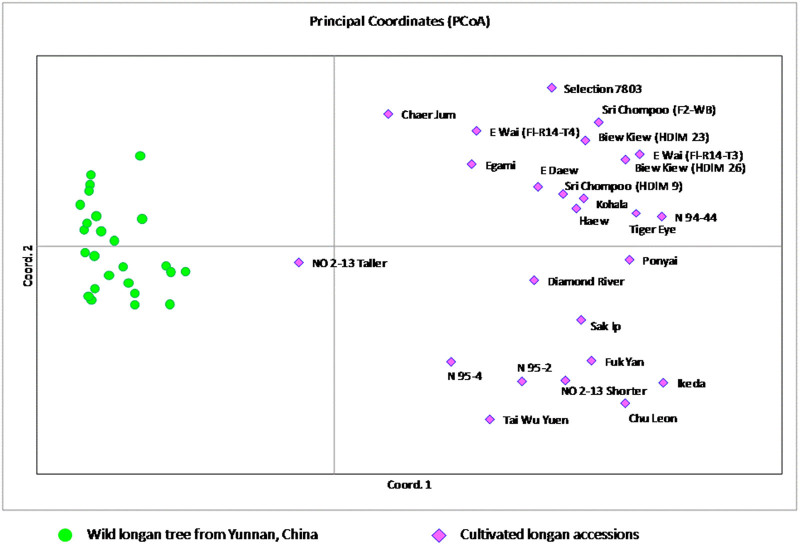
Figure 1.
PCoA plot of 50 longan accessions including 25 cultivated varieties from USDA longan collection in Hilo, Hawaii and 24 wild trees collected from Mangshi, Yunnan Province, China. The plane of the first three main PCO axes accounted for 61.0% of total variation. First axis=41.1% of total information, the second=11.9% and the third=8.0%.

