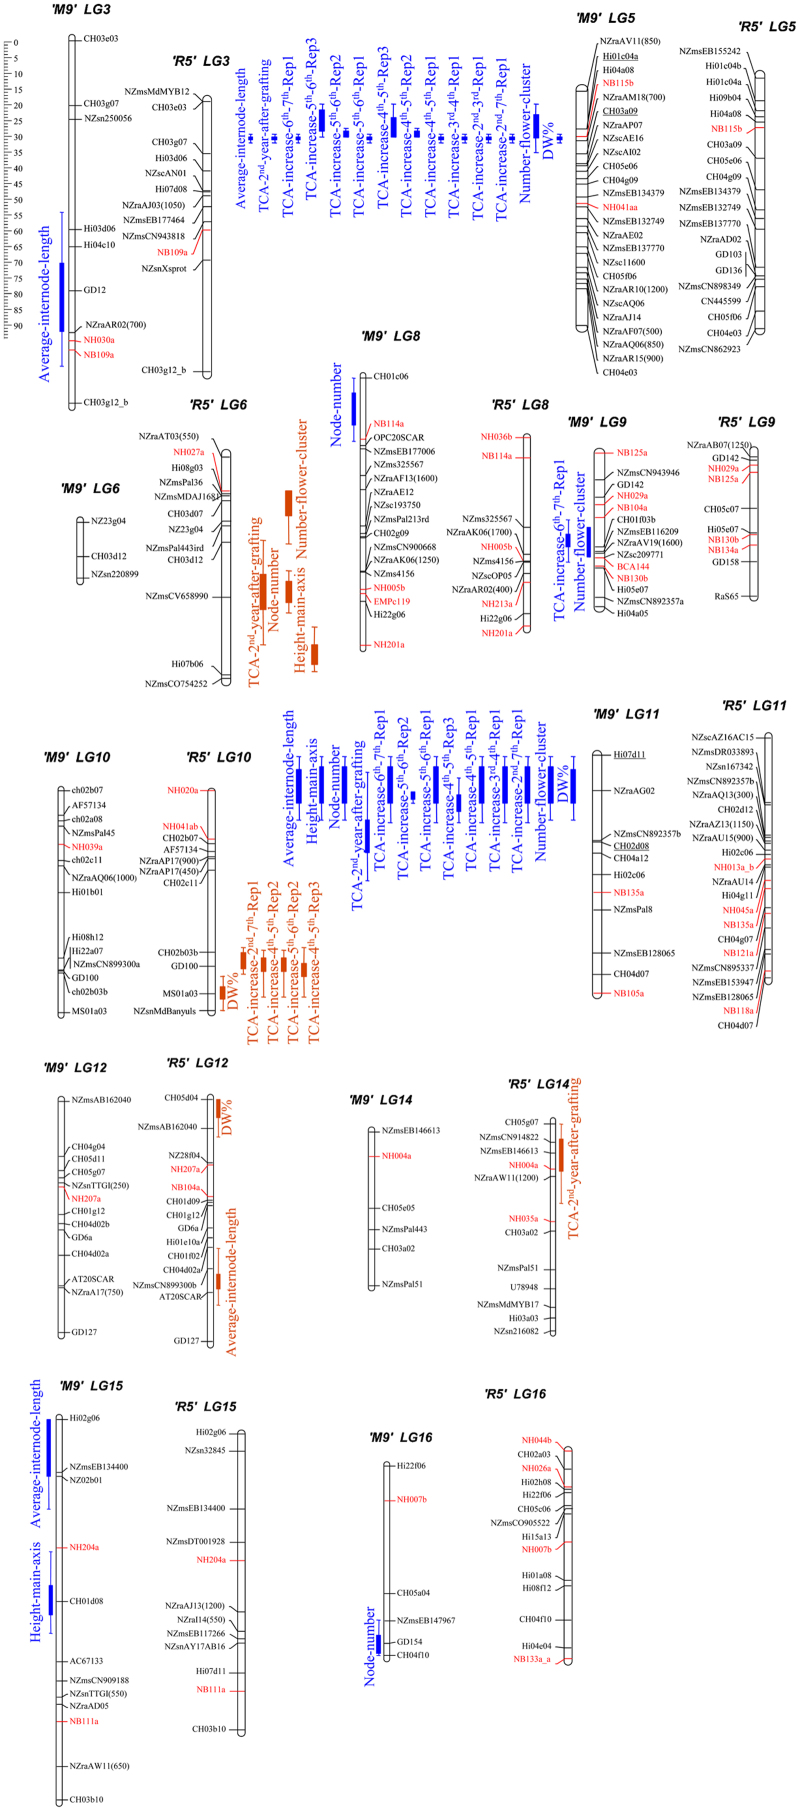
Figure 2.
Representation of rootstock QTLs influencing dwarfing and flowering traits on the LGs of ‘M9’ and ‘R5’. The solid part of the bars indicates the most likely position of the QTL and the lines represent the confidence interval. Traits phenotyped are listed in Table 1. The QTLs identified from ‘M9’ are in blue and located on the left side of the LGs, and the QTLs identified from ‘R5’ are in orange and located on the right side of the LGs. The markers flanking Dw1 and Dw2 are underlined and Pyrus SSR markers are indicated in red. Scale bar indicates genetic distance in cM. Details on the markers used to construct the ‘M9’ and ‘R5’ genetic maps are given in Celton et al.17 cM, centiMorgans.

