
Figure 3.
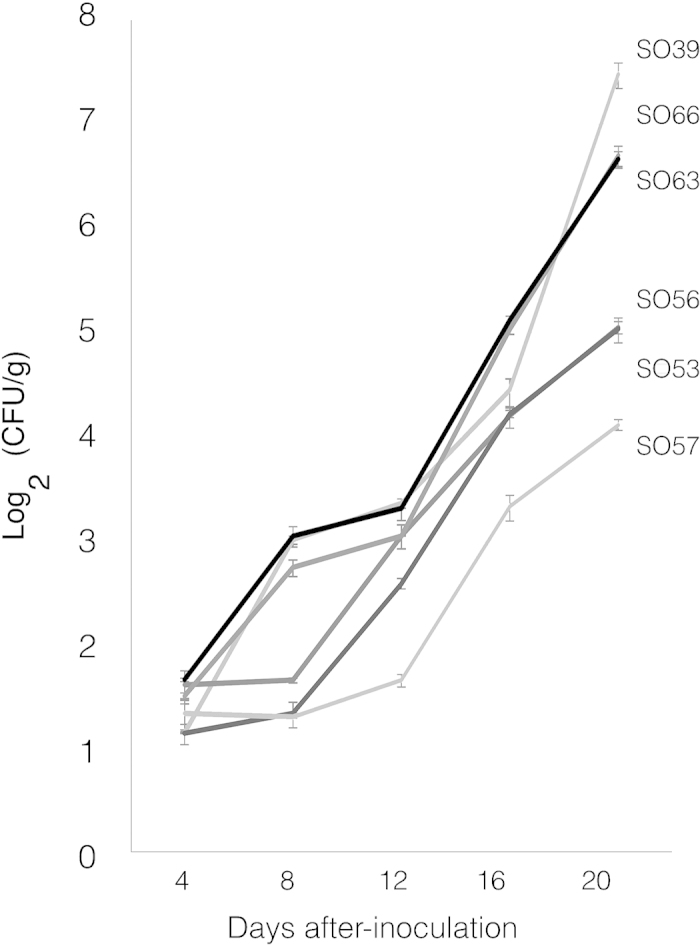
Seedlings with high ROS accumulation show reduced growth of Xcc. Growth of the Xcc bacterium in seedlings with high levels of ROS (SO53, SO56, and SO57) compared to seedlings with a low production of ROS (SO39, SO63, and SO66) was determined by qPCR for the pthA gene using two pairs of gene-specific primers designed for Xcc. Growth is represented as CFUs per gram of tissue tested. Error bars represent the standard deviation of two independent experiments.