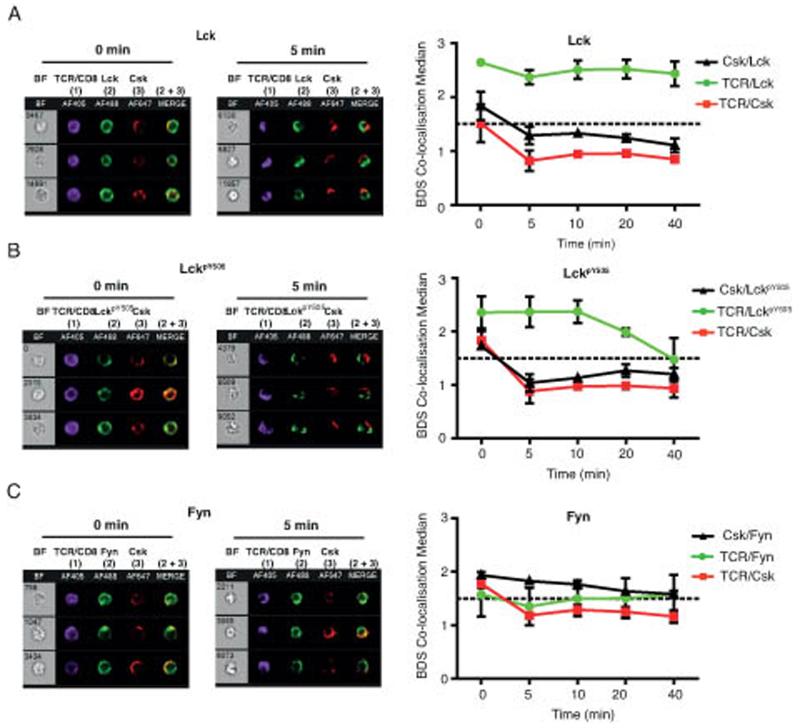
Figure 5. Csk is maintained away from the site of TCR activation in Ag-experienced CD8+ T cells.
Ag-experienced CD8+ T cells were stimulated with TCRβ/CD8α and Streptavidin AF405 (column 1) for the indicated times (0-40 min), fixed, permeabilised and intracellular proteins were stained for Csk, column 3, and in column 1 for Lck (A), or LckpY505 (B) or Fyn (C). Each panel shows representative cells from the median BDS-R3 value at 0 and 5 min, with colocalisation shown as a merge image of green and red pixels (2 + 3). Graphs of the median BDS-R3 score for the indicated image pairs on a per cell basis, are the mean of 3 independent experiments ± SEM (for some points the error bars are too small to be visible outwith the symbols). The dotted line denotes the MRB-determined threshold below which two signals are considered to be dissimilar by the BDS-R3 score (<1.5).

