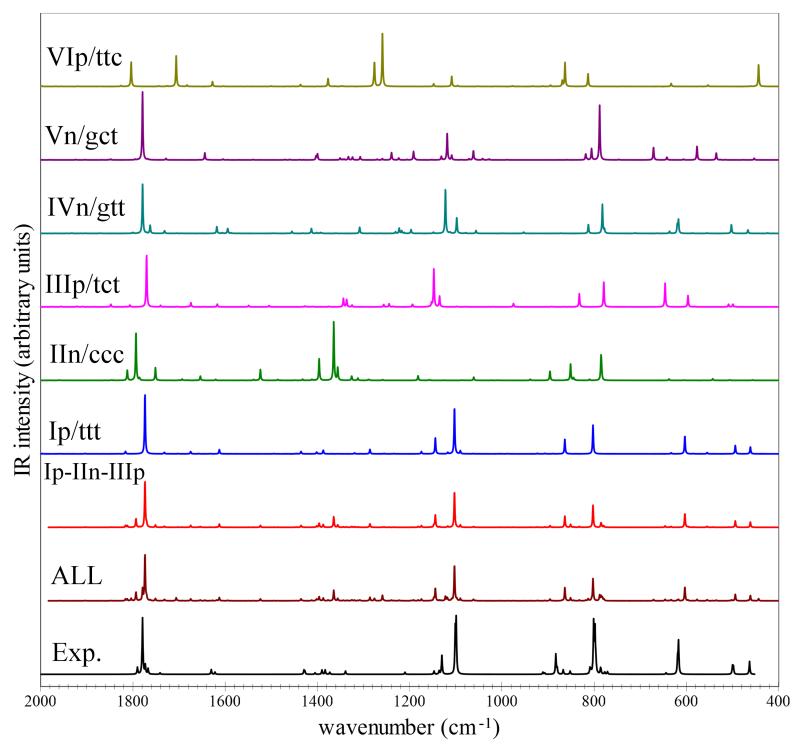
Fig. 2.
Best-estimated MI-IR spectra in the (2000-400 cm−1) frequency region, for the main glycine isotopologue. Simulated theoretical spectra: single contributions from Ip/ttt, IIn/ccc, IIIp/tct, IVn/gtt, Vn/gct and VIp/ttc, the sum of the Ip/ttt, IIn/ccc and IIIp/tct (Ip-IIn-IIIp) contributions weighted for relative abundances (as computed in this work (T=410 K), also assuming the conformational cooling IVn/gtt→Ip/ttt and Vn/gct→IIIp/tct), and the Ip-IIn-IIIp sum complemented by minor contributions (1%) from the IVn/gtt, Vn/gct and VIp/tcc (ALL). Experimental IR spectra recorded in low-temperature Ar Matrix generated using the data of Table 5 of Ref.14. IR spectra line-shapes (both theoretical end experimental) have been convoluted with Lorentzian functions with a half-width at half-maximum (HWHM) of 1 cm−1.

