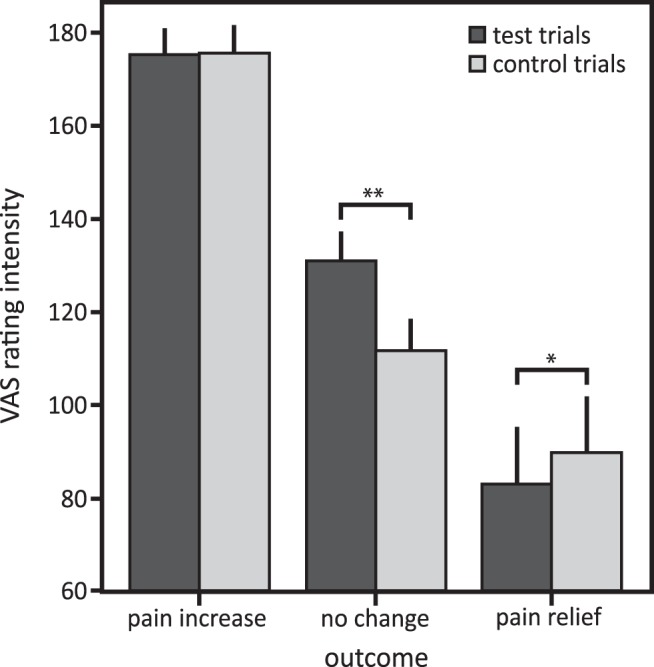
Figure 3.

Means and 95% confidence intervals of perceived pain intensity for test and control trials in the pain relief, pain increase, and no-change outcomes. post hoc comparisons: **p < 0.003, *p < 0.017, significant after Bonferroni correction for multiple testing.
