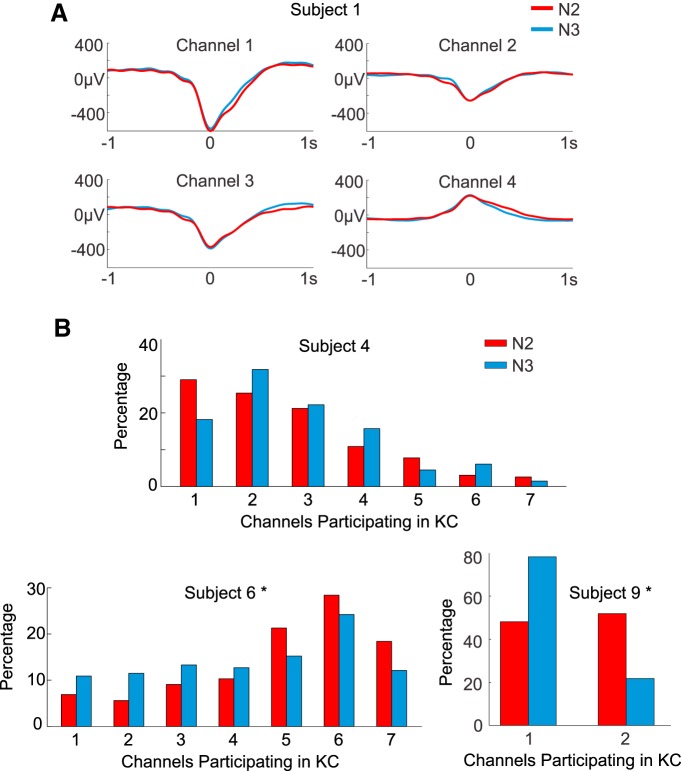
Figure 12.
Comparison of N2 and N3 KCs. A, Waveforms of averaged N2 and N3 KCs overlaid for subject 1’s four channels exhibit highly similar KC morphology. B, Multichannel KC participation is not consistently greater in N2 or N3. The percentage of KCs occurring in each number of channels for N2 (red) and N3 (blue) are plotted for subjects 4, 6, and 9. Subjects 6 and 9 show N2 KCs involving more channels, but this is not the pattern seen in all subjects, as shown with subject 4. When a χ2 test was performed for each subject on these distributions, only subjects 6 (p = 0.011) and 9 (p = 0.000056) exhibited significant differences.

