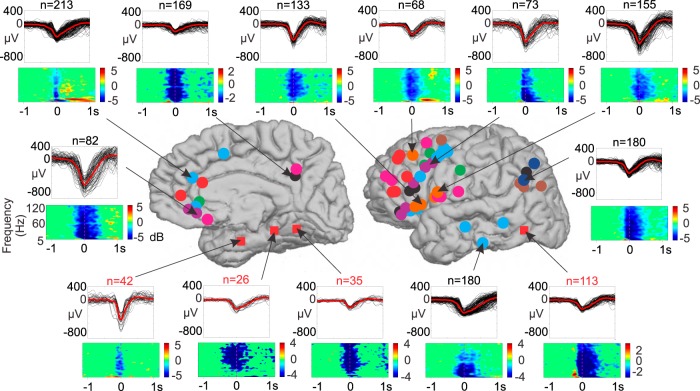
Figure 2.
Example KC localizations, waveforms, and down state confirmations. KCs are plotted from representative sites across the cortical areas sampled. Individual KCs for each bipolar location are plotted in black with the average KC overlaid in red. The number of individual KCs plotted is listed above the waveforms. Below the KC waveforms, time frequency plots from 5 to 120 Hz with a −1.5 to −0.5 s baseline relative to the most negative peak of the KC at time zero indicate a significant drop (p < 0.01, uncorrected) in high gamma power at the time of the KC. Arrows indicate the bipolar locations where the plotted waveforms and time–frequency plots were recorded. Circles indicate the subject color-coded bipolar channel locations, as in Figure 1. The four additional red squares indicate sites where KCs were located, but not included for additional analysis because they were part of an epileptic region or potentially in entorhinal cortex.

