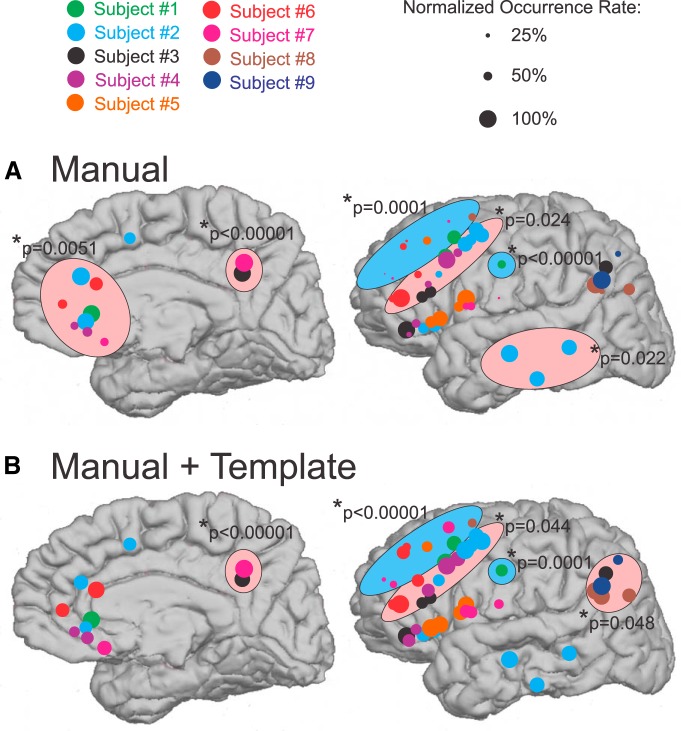
Figure 5.
KC occurrence rates vary across the cortex. A, Manually marked KCs color coded for each subject. The size of the circle indicates the KC occurrence rate at each location, normalized to the maximum KC occurrence rate seen on any channel for that subject. Black circles in the top right indicate this normalized occurrence rate scale. Locations identified by a linear mixed-effects model to have a significantly higher occurrence rate than the orbitofrontal reference are highlighted by pink circles. Locations identified as occurring significantly less frequently are highlighted by blue circles. B, KC-like activity in addition to manually marked KCs. The locations showing a lower occurrence rate are the same as in A. The locations showing a higher occurrence rate differ with the addition of the template-detected KCs.

