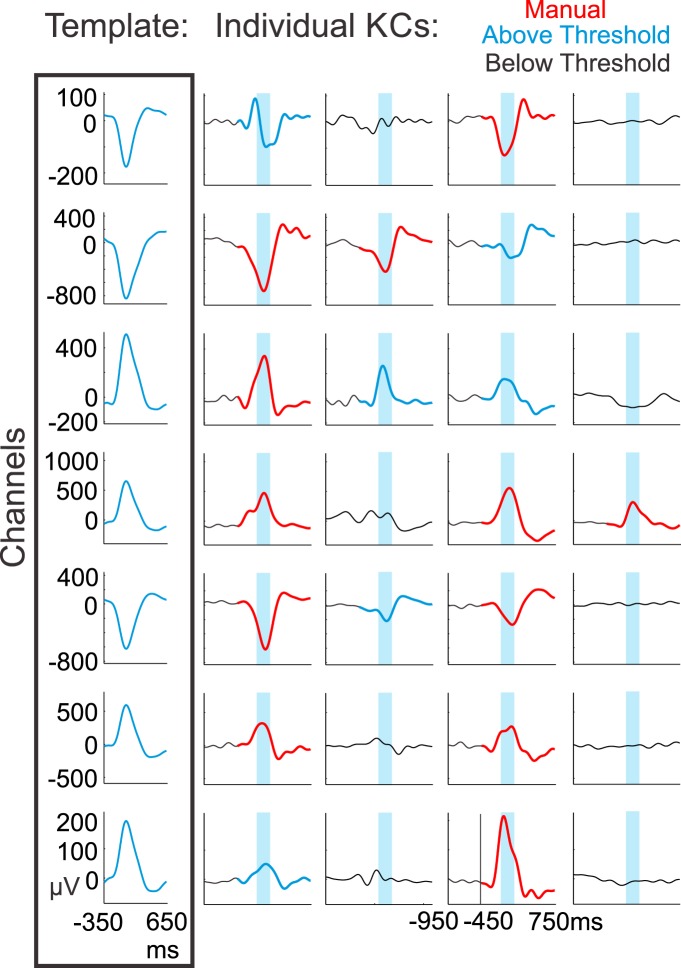
Figure 8.
Template application to detect KC-like activity. Channel-specific templates were created for each subject by averaging from −350 to +650 ms on the most negative peak at time zero over the manually detected KCs in each channel (box at left). The channel-specific templates were then applied when a manually marked KC occurred in at least one channel. The templates were applied from −450 to +750 ms, with time zero representing the average time between the first and last manually chosen channel peaks within a KC. Four such examples from subject 6 are plotted vertically. Manually marked KCs are plotted in red. The maximum value of the sliding inner product between the signal and the template was taken over the blue highlighted window. If the value was above the 99th percentile of the null distribution for that channel and corresponded to the largest (or smallest) peak over the entire 1200 ms window, the KC was recorded as KC-like activity (KCs in blue), and if it was below the threshold, it was not (signal in black).

