Figure 9.
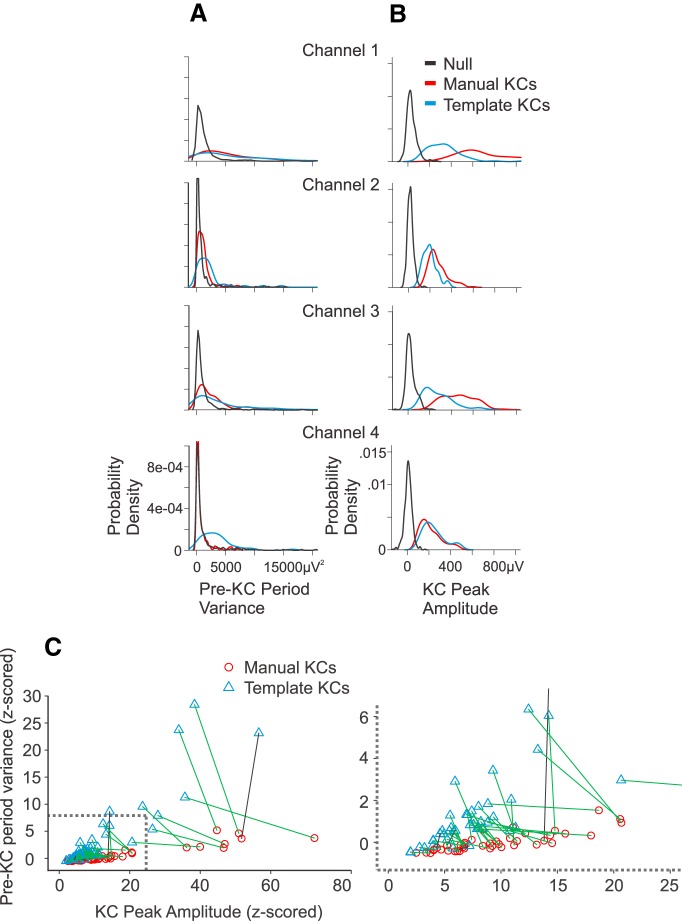
Manually detected KCs have smaller pre-KC period variance and larger amplitude than template-detected KCs. A, The probability density of variance in the pre-KC period (−1.4 to −0.4 s prior to peak) is plotted for the null times (black), manually detected KCs (red), and template-detected KCs (blue) for each of subject 1’s four channels. B, The KC peak amplitude probability density of null times (black), manually detected KCs (red), and template-detected KCs (blue) are plotted for the same four channels as in A. C, For each channel, the manually detected (red circles) and template-detected (blue triangles) z-scores were calculated for the KC peak amplitude and the pre-KC period variance referenced to the null values. A line connects the manually detected and template-detected values for each channel. A green line indicates that the amplitude of template-detected KCs is smaller than that of manually detected KCs in that channel; a black line indicates the opposite relationship. On the right is an expansion of the lower left corner, which is outlined by a gray box.

