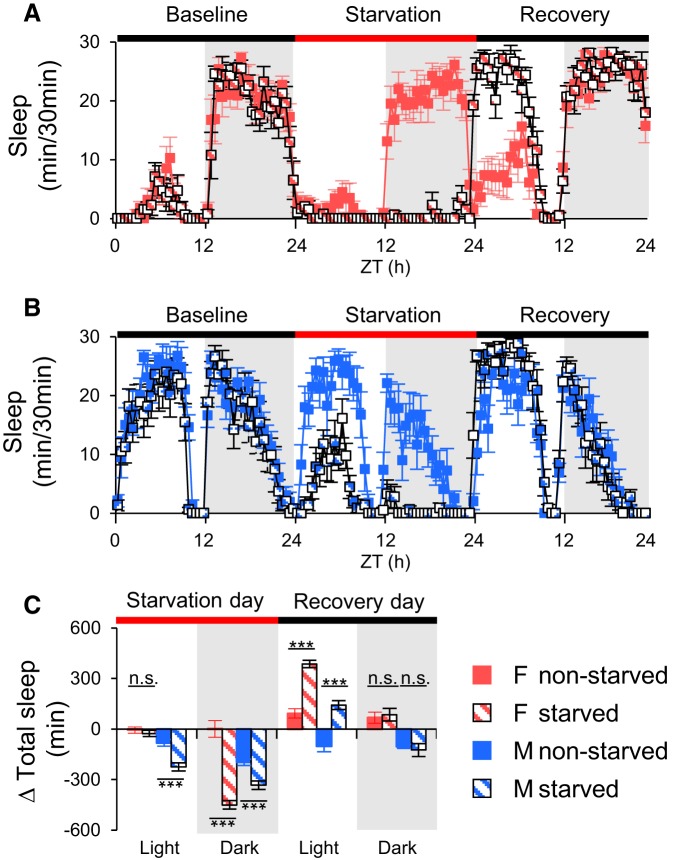
Figure 4.
Suppression of sleep by starvation generates rebound sleep in populations. Sleep patterns generated by starvation in female (A) and male (B) flies in populations. C, Total daytime and nighttime sleep changes are plotted as mean ± SEM. Male flies’ sleep was reduced significantly during the day and night, but female flies’ sleep was significantly suppressed only in the night. Red bar indicates the starvation period. Twenty-four hour starvation-induced sleep loss was compensated after feeding on the recovery day. Δ Total sleep: total sleep changes. n = 8 for all conditions. ***p < 0.0001; n.s., no significant difference. ZT, Zeitgeber time; F, female; M, male.

