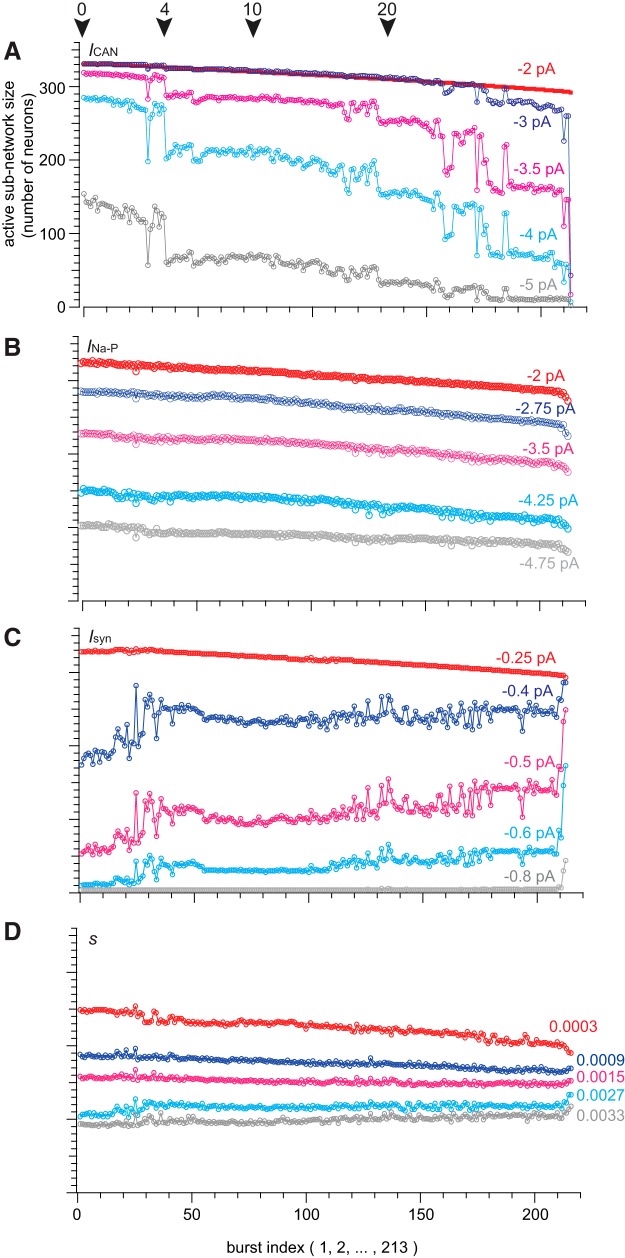
Figure 4.
Active subnetwork properties for a sequence of inspiratory-like bursts given different ICAN thresholds. A, Active subnetwork size (number of neurons) for five representative ICAN thresholds (indicated above each trace) plotted versus sequential burst indices (1–213) for one simulation. Color represents different threshold values. Arrows indicate deletions 0, 4, 10, and 20. B, Active subnetwork size (number of neurons) for five representative INa-P thresholds (indicated above each trace) plotted versus sequential burst indices (1–213) for one simulation. C, Active subnetwork size (number of neurons) for five representative Isyn thresholds (indicated above each trace) plotted versus sequential burst indices (1–213) for one simulation. D, Active subnetwork size (number of neurons) for five representative s thresholds (indicated above each trace) plotted versus sequential burst indices (1–213) for one simulation.

