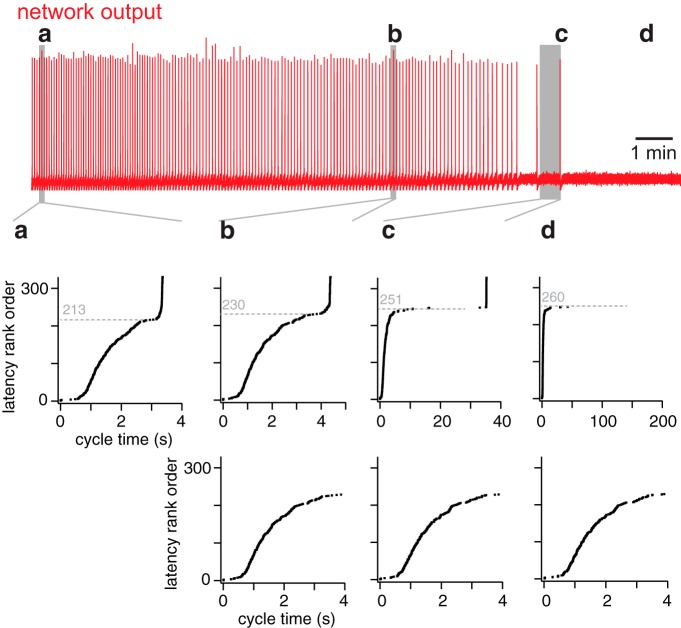
Figure 8.
Latency rank order of all constituent neurons in the network at four specific time points in a simulation. Top (red), The running time spike histogram for a random neuron deletion simulation. a, b, and c indicate three cycles leading to network-wide bursts (at time points 16, 557, and 814 s, respectively). d, The time after the last burst. The middle shows the latency rank order (defined in Results) for cycles a, b, and c, and after rhythm termination (d) plotted versus cycle time (in seconds). The dotted line indicates latency rank order (unitless) of the neuron after which the curve inflects upward, leading to a network-wide burst. The lower panel shows the same data as the middle, but where cycle time is limited to 0–4 s, emphasizing the similarity of b, c, and d.

