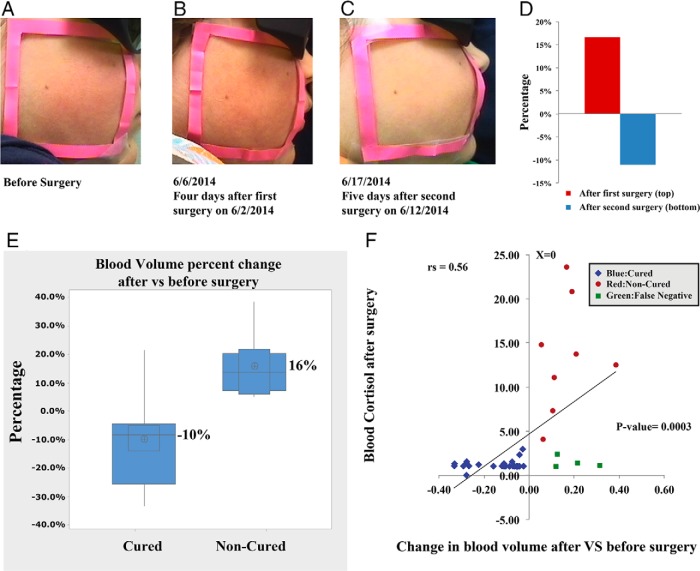
Figure 1.
A—C, Facial plethora in a patient with CD before TSS, after the first TSS (noncured), and after the second TSS (cured). D, The blood volume fraction percentage change of the patient's left cheek in panels A–C at different imaging sessions. E, Boxplot of mean percentage change indicating change in blood volume after surgery, compared to before surgery, in each of the cured and noncured Cushing's patients. The distribution shows median confidence interval box and interquartile range. F, Change in blood volume from pre- to postsurgery vs blood cortisol level after surgery in 34 patients undergoing 36 surgical treatments for CS.

