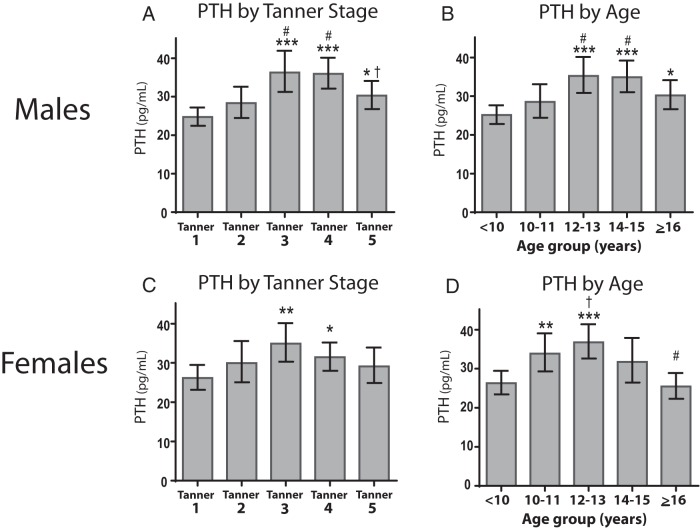
Figure 1.
Levels of PTH by sex, Tanner stage, and age. Mean levels and 95% CIs of PTH for males (A and B) and females (C and D) from unadjusted regression analysis of natural log-transformed values, back-calculated to original units. Comparison to Tanner 1: *, P < .05; **, P < .01; ***, P < .001; comparison to Tanner 2: #, P < .05; comparison to Tanner 4: †, P < .05.

