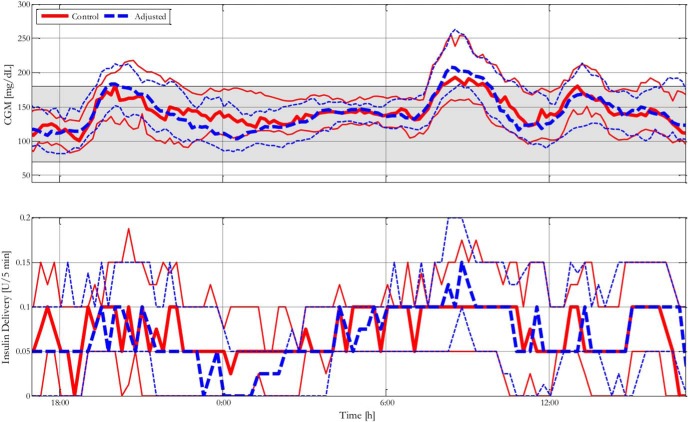
Figure 2.
Blood glucose control performance characterized by median and interquartile range glucose and insulin traces of % time in clinical range of 32 adult subjects with control or adjusted clinical parameters. The solid line represents subjects with control parameters; the dashed line represents subjects with adjusted parameters.

