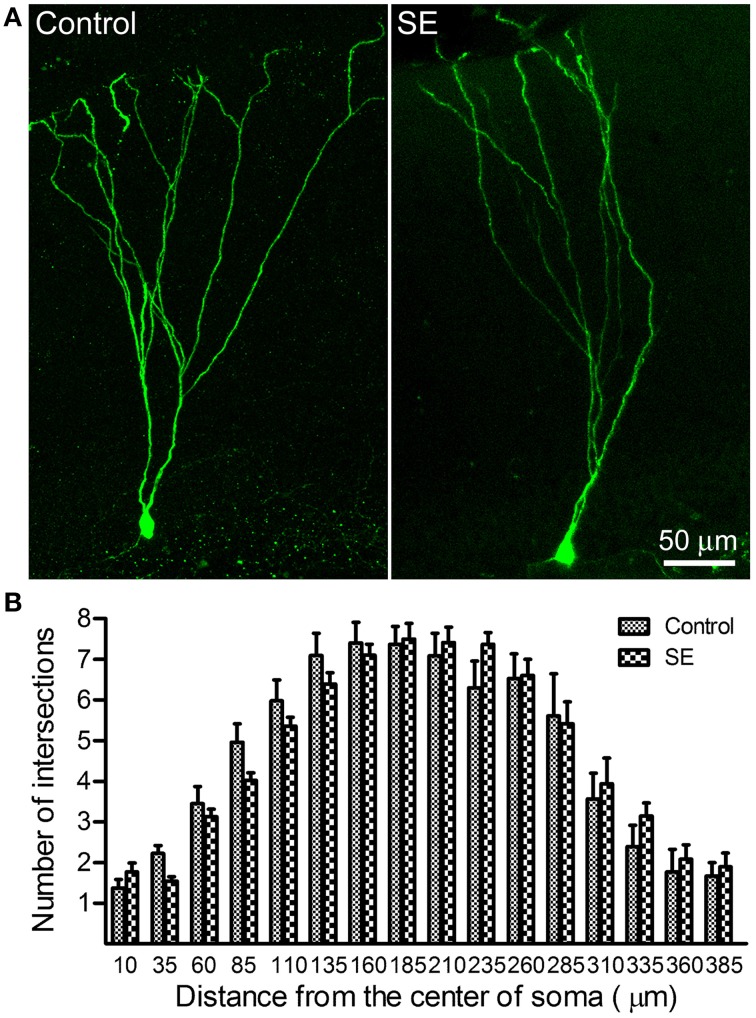
Figure 2.
Sholl analysis dedicates the dendritic complexity of mature newborn granule cells in control and SE rats. Z-series stacks of 2 μm thick were taken in GFP-positive cells located in the suprapyramidal blade with a 20X objective (zoom = 1) and, thereafter, a 3D-image was created for each cell. After the soma and the apical dendritic arborizations were traced under ImageJ (http://imagej.nih.gov/ij/) with the NeuronJ plugin (http://www.imagescience.org/meijering/software/neuronj//), Sholl analysis was carried out by using ImageJ with the “Sholl analysis” plugin. (A) Representative images of retroviral labeling of newborn granule cells in a control (left panel) and an SE rat (right panel). Note that the granule cell born after SE has branch orders and arborizations similar to that of one born naturally. (B) Bar graph shows the dendritic complexity of newborn granule cells revealed by Sholl analysis. In both the control and SE groups (n = 8 animals each), 3–4 cells for each rat were scanned and all values at a given distance were averaged. Data are statistically compared using repeated-measure ANOVA.

