Figure 3.
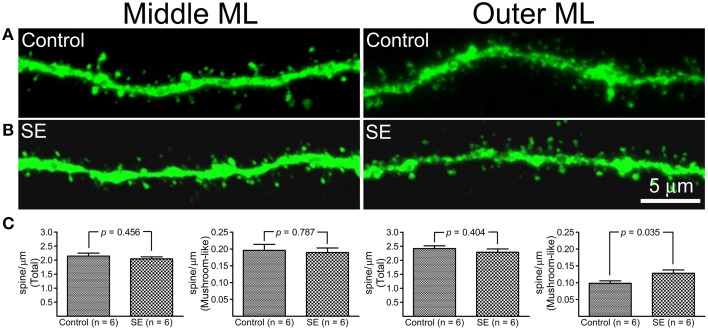
A comparison of dendritic spine density in mature granule cells born after status epilepticus (SE) or sham treatment (Control). Z-series stacks were conducted in dendritic segments that were located in the middle molecular layer (middle ML) and outer molecular layer (Outer ML). (A) Representative confocal images of dendritic segments in the middle ML and outer ML in a control rat. (B) Representative confocal images of dendritic segments in the middle ML and outer ML in an SE rat. (C) Bar graphs comparing total and mushroom-like spine densities between the control and SE rats (n = 6 animals each). For each animal, spine densities were calculated from three cells; total six dendritic segments (three in the middle molecular layer and another three in the outer molecular layer) each cell were scanned and all values in the same layer were averaged. The left two panels represent dendritic segments in the middle molecular layer, and the two panels in the right represent dendritic segments in the outer molecular layer.

