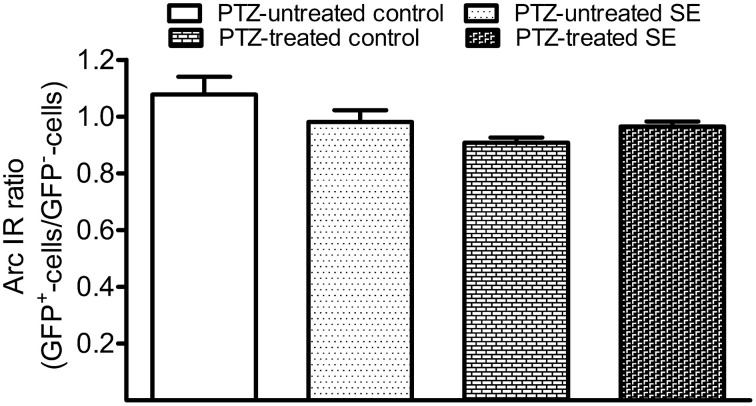
Figure 8.
Bar graphs compare Arc immunoreactivity (IR) in the GFP-labeled newborn granule cells to surrounding GFP-negative granule cells in the resting condition and during the period of a transient seizure. The relative intensity of Arc IR in individual GFP-positive cells was normalized to the averaged Arc IR of 10 surrounding granule cells that represent existing granule cells. Each group contains six datasets in which each dataset was acquired from 10 GFP-labeled cells of each animal. Bars are standard error of the mean (SEM). Note that the Arc ratio is higher and more variable in PTZ-untreated control but very close to 1.0 in the rest of three groups. Statistical significances do not exist among the four groups as revealed by one-way variance analysis.

