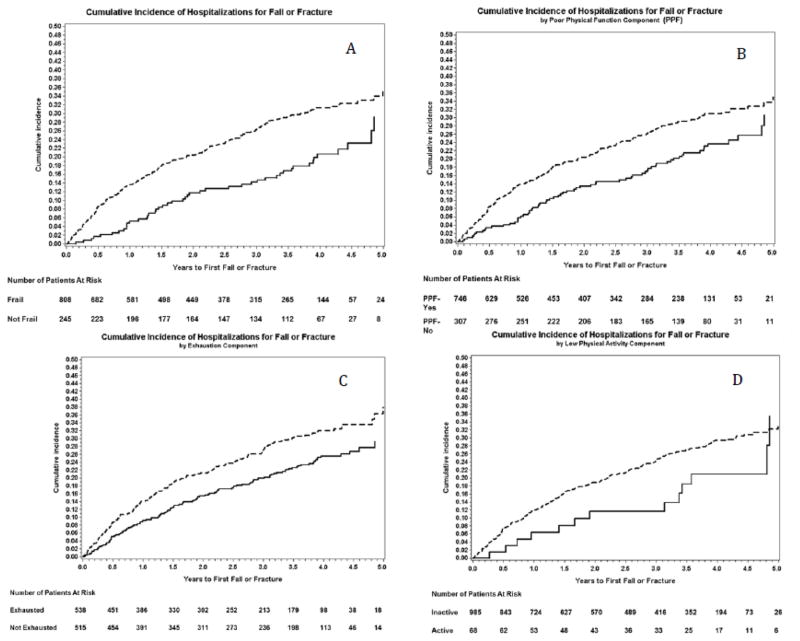
Figure 1.
Cumulative Incidence Plots of Self-reported Frailty and its Components with time to First Fall or Fracture. Panel A: Frailty; Panel B: Poor Physical Function (PPF); Panel C: Exhaustion; Panel D: Low Physical Activity. Dashed line; Individuals who endorsed frailty or component, Solid line those who did not.

