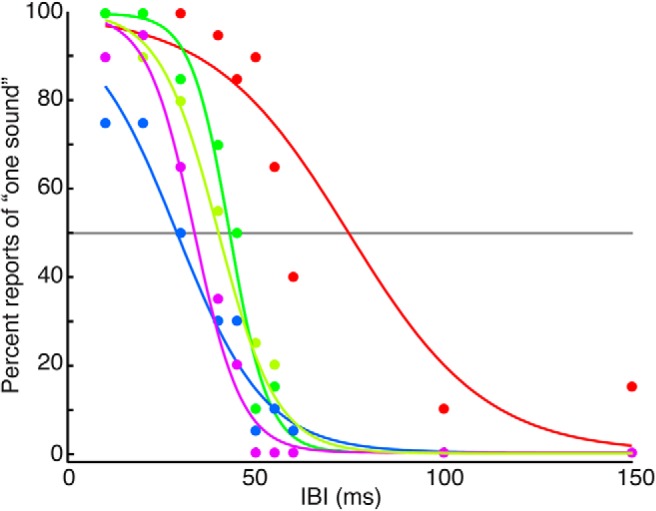
Figure 3.

Influence of IBI on reports of perceived grouping. Subjects reported whether they perceived the stimulus as one sound or discrete sounds. The graph shows proportion of trials in which each subject chose one sound as a function of IBI. The points indicate each subject’s performance. Each curve represents a logistic function that was fit to each subject’s reports across four sessions. The gray line indicates 50% of trials reported as “one sound”, which was IBI threshold. Colors represent different subjects.
