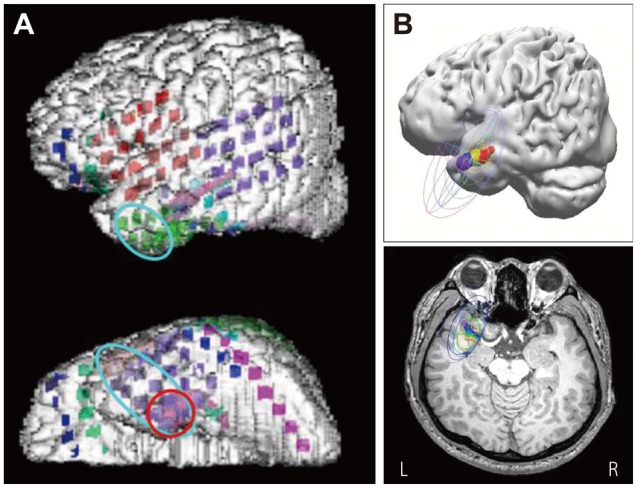
Fig. 4.

The comparison between ECoG and EEG dipoles of patient #26. The patient had left mesial temporal lobe epilepsy. A: Intracranial EEG electrode locations were plotted on the patient's three dimensional MRI. Red circle indicates the electrode location of ictal ECoG onset, and bright blue circle indicates the location of interictal spikes frequently recorded on ECoG. B: EEG dipoles of averaged 64 spikes with different high-pass filter settings: red: 0.5 Hz, orange: 1 Hz, yellow: 2 Hz, green: 3 Hz, bright blue: 4 Hz, blue: 5 Hz, violet: 6 Hz. The circle around each dipole indicates confidence ellipsoid range. L: left, R: right.
