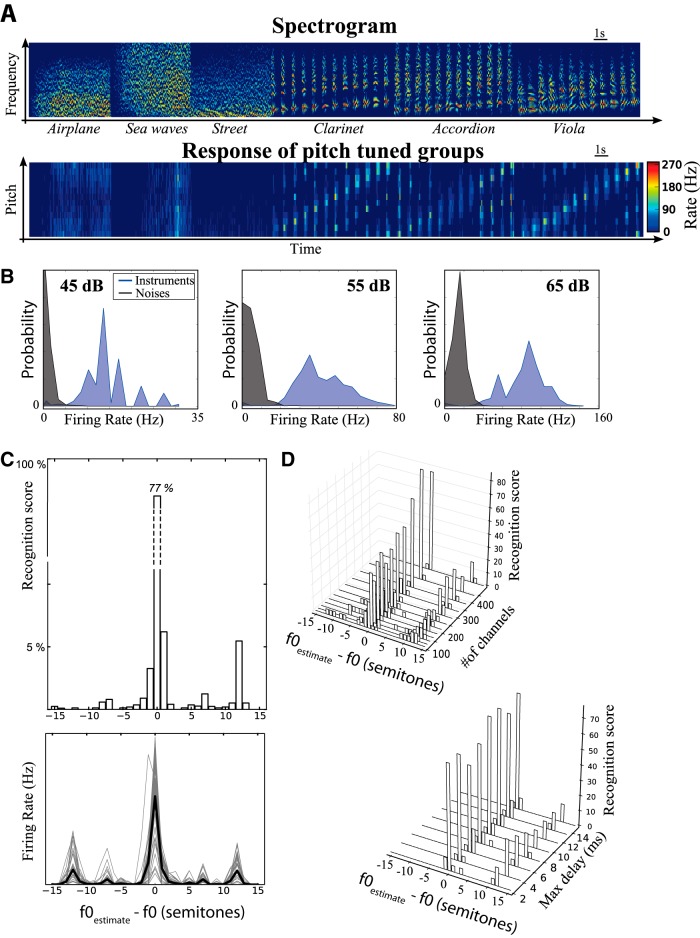
Figure 5.
Pitch recognition by a neural network model based on the structural theory. A, Top, Spectrogram of a sequence of sounds, which are either either environmental noises (inharmonic) or musical notes of the chromatic scale (A3-A4) played by different instruments. Bottom, Firing rate of all pitch-specific neural groups responding to these sounds (vertical axis: preferred pitch, A3−A4). B, Distribution of firing rates of pitch-specific groups for instruments played at the preferred pitch (blue) and for noises (grey) for three different sound levels. C, Top, Pitch recognition scores of the model (horizontal axis: error in semitones) on a set of 762 notes between A2 and A4, including 41 instruments (587 notes) and five sung vowels (175 notes). Bottom, Firing rate of all pitch-specific groups as a function of the difference between presented f0 and preferred f0, for all sounds (solid black: average). Peaks appear at octaves (12 semitones) and perfect fifths (7 semitones). D, Impact of the number of frequency channels (top) and maximal delay δmax (bottom) on recognition performance.

