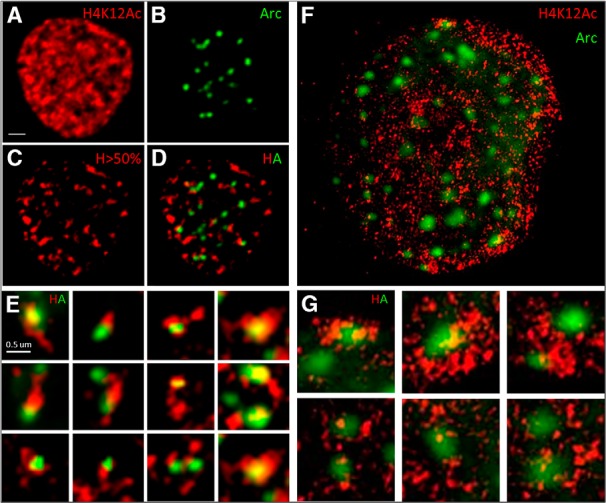
Figure 12.

Arc associates with H4K12Ac. A−E, A representative hippocampal neuronal nucleus showing H4K12Ac staining (A) and Arc-YFP puncta (B). The same image with increasing the brightness threshold to show only the brightest 50th percentile H4K12ac shows clear H4K12Ac hotspots (C), which is overlaid with localized Arc-YFP puncta (D; scale bar, 1 μm). Insets below show association of Arc puncta with H4K12ac hotspots (E; scale bar, 200 nm). Hippocampal cultures were treated with 4AP, bicuculline, and forskolin for 4 h to induce Arc expression. F, A representative image of a hippocampal neuron that has been transfected with Arc-YFP, showing Arc-YFP puncta (green), imaged with structured illumination microscopy to observe the localization of H4K12Ac (red) in higher resolution. The increased resolution afforded by SIM did not substantially change the Arc puncta. However, the H4K12Ac staining, which appeared fairly homogenous in A, can now be seen to consist of many tiny structures, the size of which is just below the resolution of the conventional light microscope. They are distributed fairly uniformly over the nucleus, although local concentrations can be observed, which would correspond to the hotspots in C. Some of these clusters of H4K12Ac seemed to associate with Arc puncta. Scale bar, 1.7 μm. G shows six Arc puncta at higher magnification. The top row shows an Arc puncta associating with dense H4K12Ac clusters, while the bottom row shows a few bright H4K12Ac structures surrounding Arc puncta. Scale bar, 500 nm.
