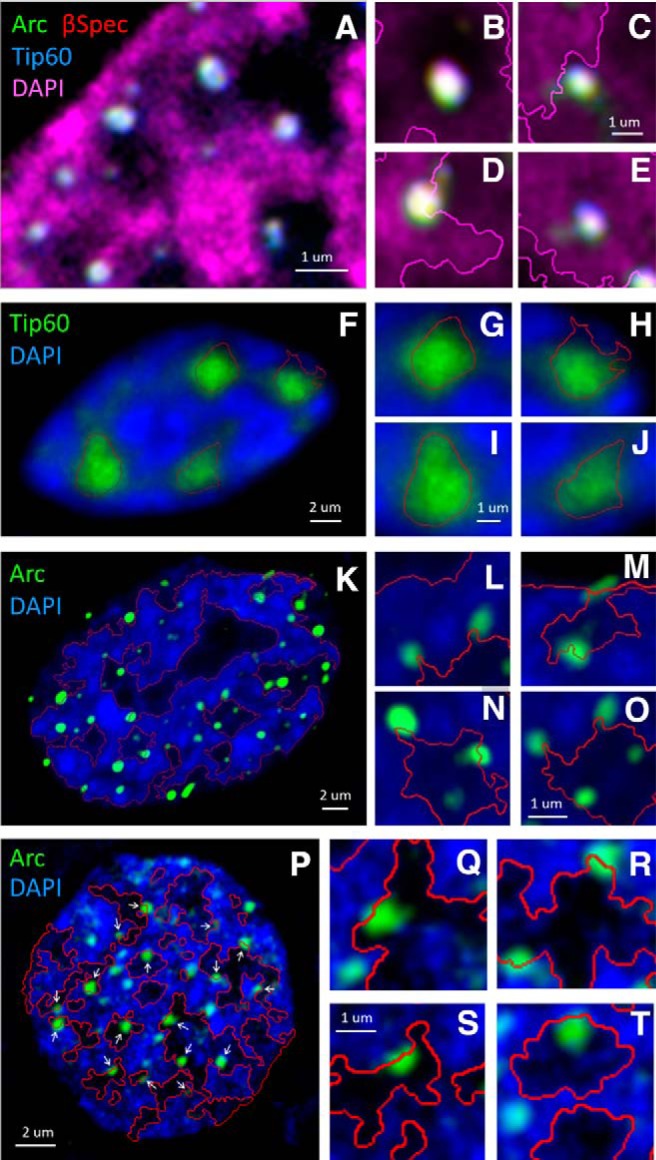
Figure 4.

Arc localizes the Arc-β-Spectrin-Tip60 complex to the perichromatin region. A, Fluorescently-tagged versions of Arc (green), β-Spectrin (red), and Tip60 (blue) were coexpressed in HEK293 cells and imaged as described in Fig. 3. Because of their strict overlap, Arc-β-Spectrin-Tip60 complexes appear as white puncta. The DAPI signal is shown in magenta. The insets (B−E) show the relationship between individual complexes and chromatin with higher magnification. Segmentation of the DAPI structures is indicated with a magenta line. B shows a complex in the center of an interchromatin domain. C and D show complexes localized to the perichromatin region, while E illustrates a complex surrounded by dense DAPI staining. Analysis of five nuclei indicated that the majority of puncta were localized to the perichromatin region (84%, n = 151), while the puncta were less frequently observed in the center of the interchromatin region (9%, n = 16) or in densely packed chromatin (7%, n = 12). F, Tip60-YFP was expressed in HEK293 cells, which were fixed as stained for DNA by DAPI. Tip60 occupies large parts of the interchromatin domains. Insets (G−J) show individual Tip60 speckles in higher magnification. Not the larger size of Tip60 compared to the tripartite complexes shown in B−E. K, Arc-YFP was expressed in HEK293 cells, which were fixed and stained with DAPI. Many small Arc puncta are seen, which associate with the interface of the IC domains and the dense chromatin strongly labeled with DAPI, indicated with a red line that segments the DAPI structure. Insets (L−M) show the relationship of Arc puncta with chromatin at higher magnification. P, Arc-YFP was expressed in hippocampal neurons (18 DIV), which were fixed and labeled with DAPI. White arrows indicate Arc puncta that localize to the interchromatin -chromatin interface indicated with the red line. Insets (Q−T) show Arc localization in higher magnification.
