
Fig. 10.
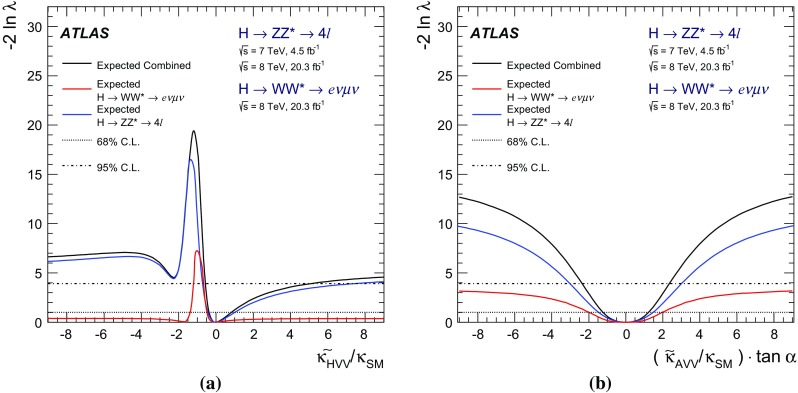
Expected distributions of the test statistic for the combination of and analyses as a function of BSM coupling ratios a and b . The expected values are estimated for the signal strengths measured in data and assuming best-fit values for all other nuisance parameters. The 68 % and 95 % CL exclusion regions are indicated as lying above the corresponding horizontal lines. The individual distributions for and channels are shown