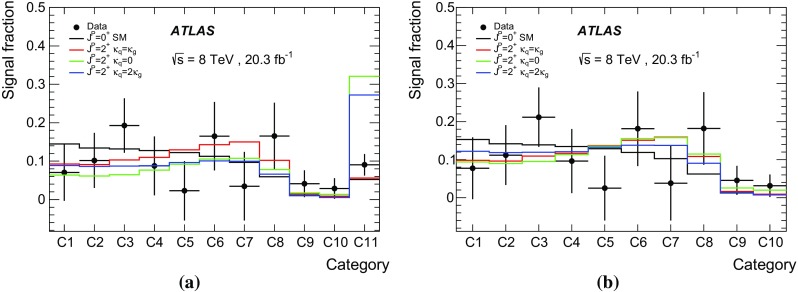
Fig. 2.

Observed signal fraction per category for the analysis, and comparison to expected values for a SM Higgs boson and for a spin-2 particle with different choices of QCD couplings. a The 11 categories described in the text are displayed, corresponding to the selection; b the high- category is discarded and the signal fractions are renormalised over the 10 remaining categories, corresponding to the selection
