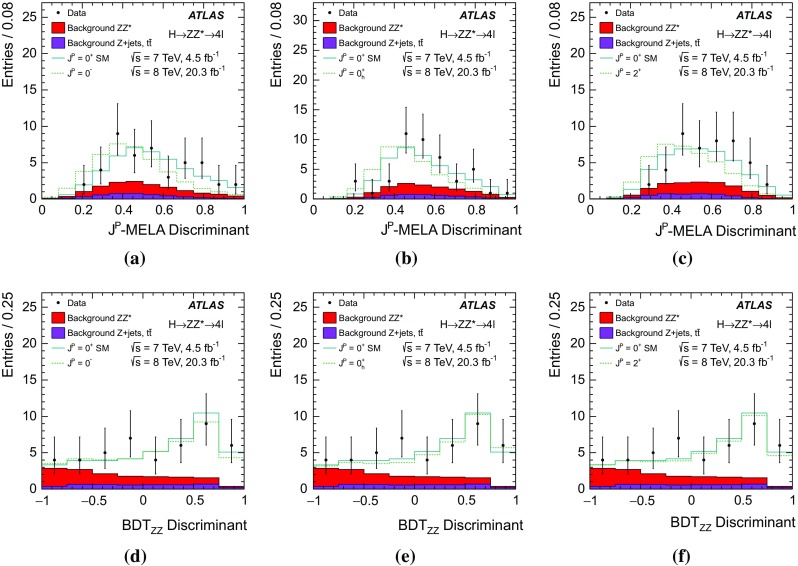
Fig. 6.

Distributions of the -MELA and of the discriminants in the signal region for the data (points with errors), the backgrounds (filled histograms), and for predictions for several spin and parity hypotheses. The SM hypothesis is shown by the solid line while the alternative hypotheses are shown by the dashed lines. The signal distributions are normalised to the signal strength fitted in data. a–c -MELA discriminants for SM vs , SM vs and SM vs , respectively; d–f discriminant for SM vs , SM vs and SM vs , respectively
