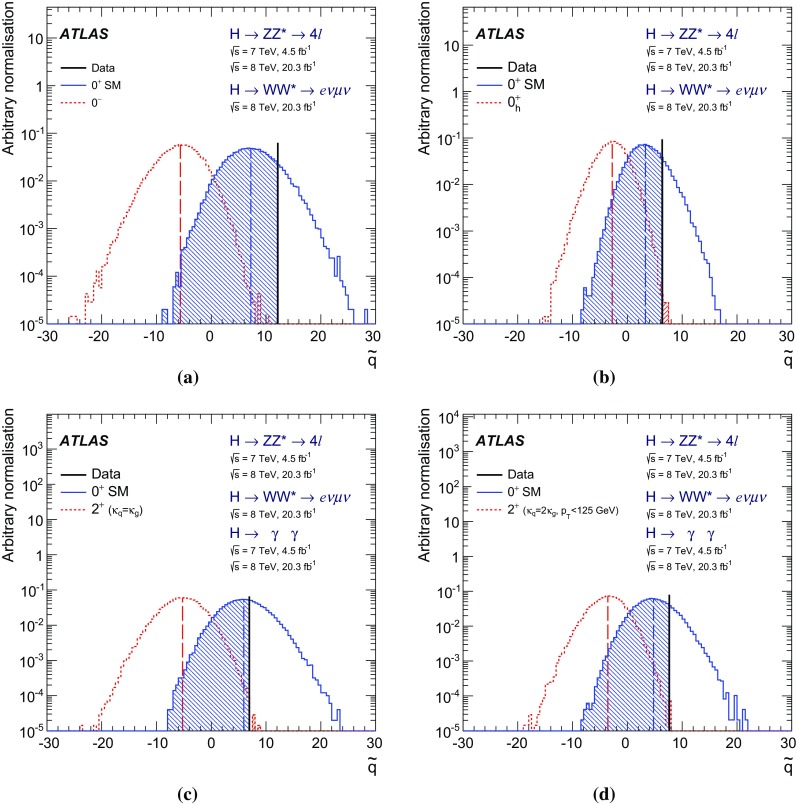
Fig. 7.

Examples of distributions of the test statistic defined in Sect. 5.1, for the combination of decay channels. a versus ; b versus ; c versus the spin-2 model with universal couplings (); d versus the spin-2 model with and the selection at 125 GeV. The observed values are indicated by the vertical solid line and the expected medians by the dashed lines. The shaded areas correspond to the integrals of the expected distributions used to compute the p-values for the rejection of each hypothesis
