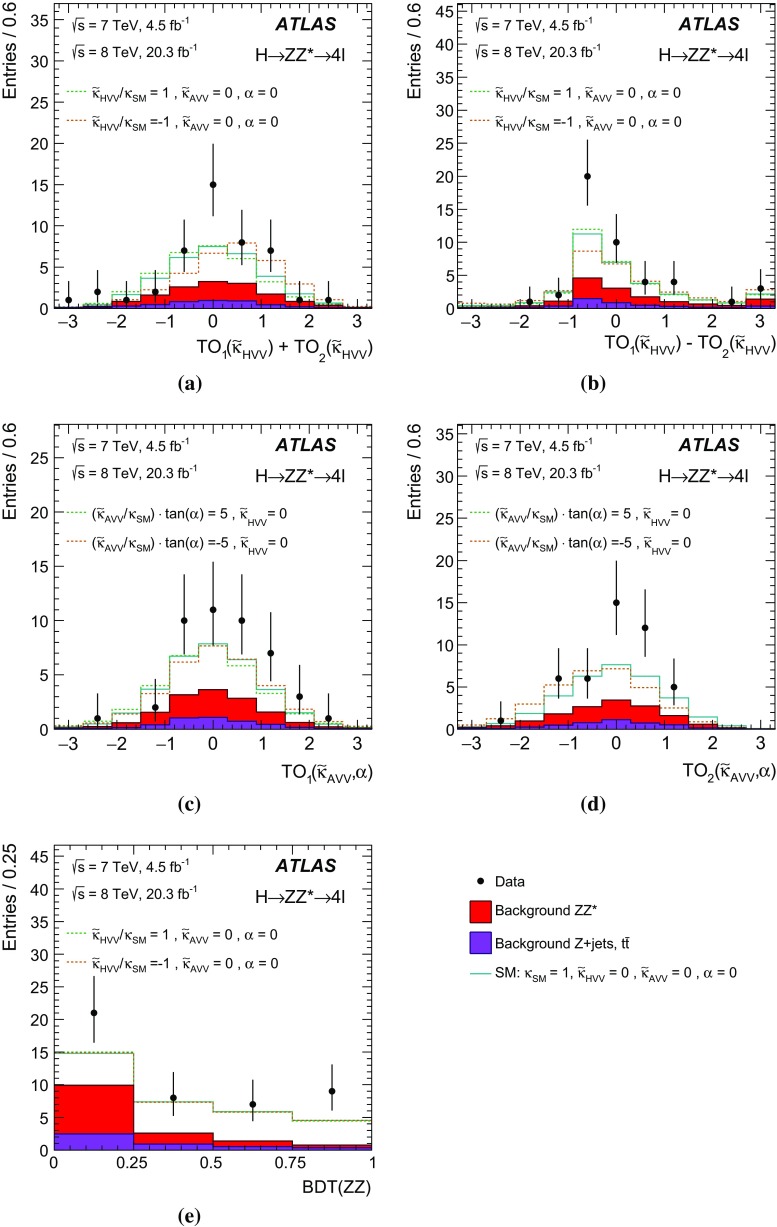
Fig. 8.
Distributions of the observables used in the matrix-element-observable fit. a , b , for the Monte Carlo signal generated with . c , d for the Monte Carlo signal generated with . e for the Monte Carlo signal generated with . The expected background contributions are shown as filled histograms on each plot

