
Fig. 9.
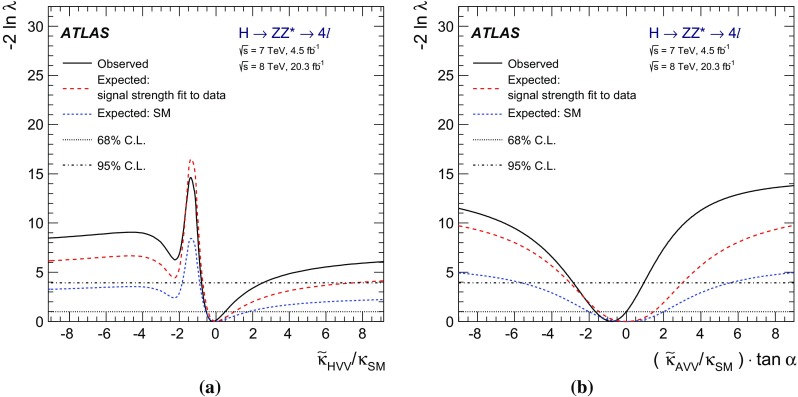
Expected and observed distributions of the test statistic for fits of a and b for the analysis. The expected curves are calculated assuming the SM signal and produced with the SM signal strength and with the signal strengths fitted to data. The horizontal dotted black lines represent the levels of above which the values of coupling ratios under study are excluded above and CL, respectively