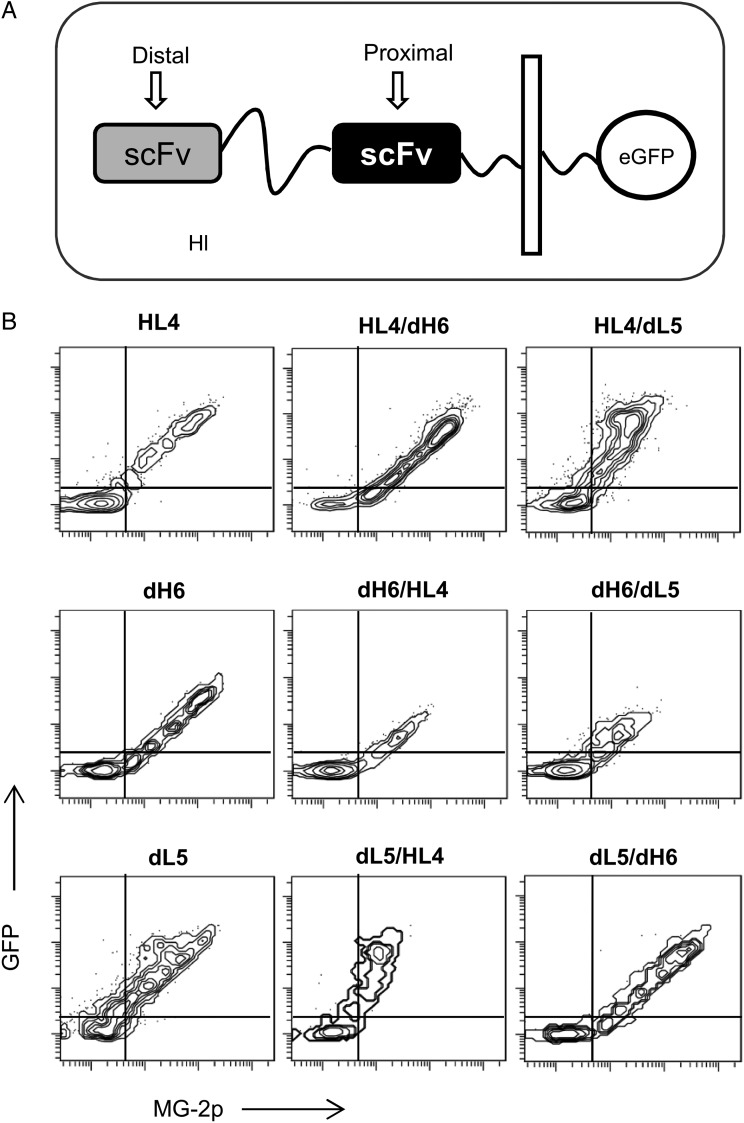
Fig. 3.
Fluorescence analysis using combinations of same color tandem scFvs and a cytoplasmic eGFP domain. (A) Graphical display of constructs at the cell surface. (B) Flow cytometry graphs from HEK-293 cells expressing each construct at the cell surface and measured in the presence of 150 nM MG-2p.

