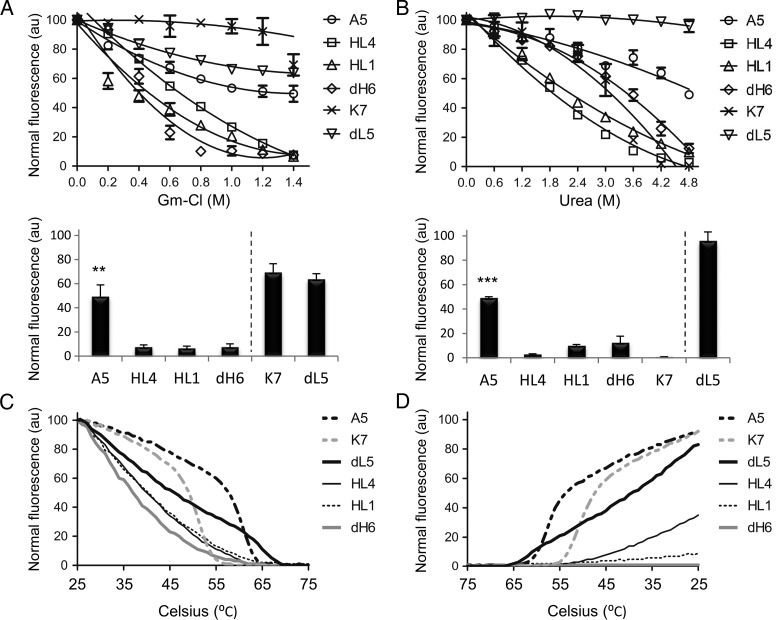
Fig. 4.
Measuring in vitro protein stability from scFv monomers. (A) The top graph corresponds to the measured fluorescence intensity of each scFv in the presence of increased concentration of Gm-Cl, while the bottom bar graph shows the fluorescence intensities of each scFv at the highest concentration of Gm-Cl from the top graph. (B) Same as previous, but in the presence of increased urea concentration. (C) Graph of fluorescence intensities from each scFv at an increased thermal gradient. (D) Graph of fluorescence intensities from each scFv (post-thermal denaturation) at a decreased thermal gradient.

